#088 About Prometheus
Learning the basics of Prometheus and running a demo with Docker and a Sinatra Ruby target application.
Notes
Prometheus is an open-source systems monitoring and alerting toolkit.
the following was written with Prometheus 2.13.0 compiled with go 1.13.1.
Architecture
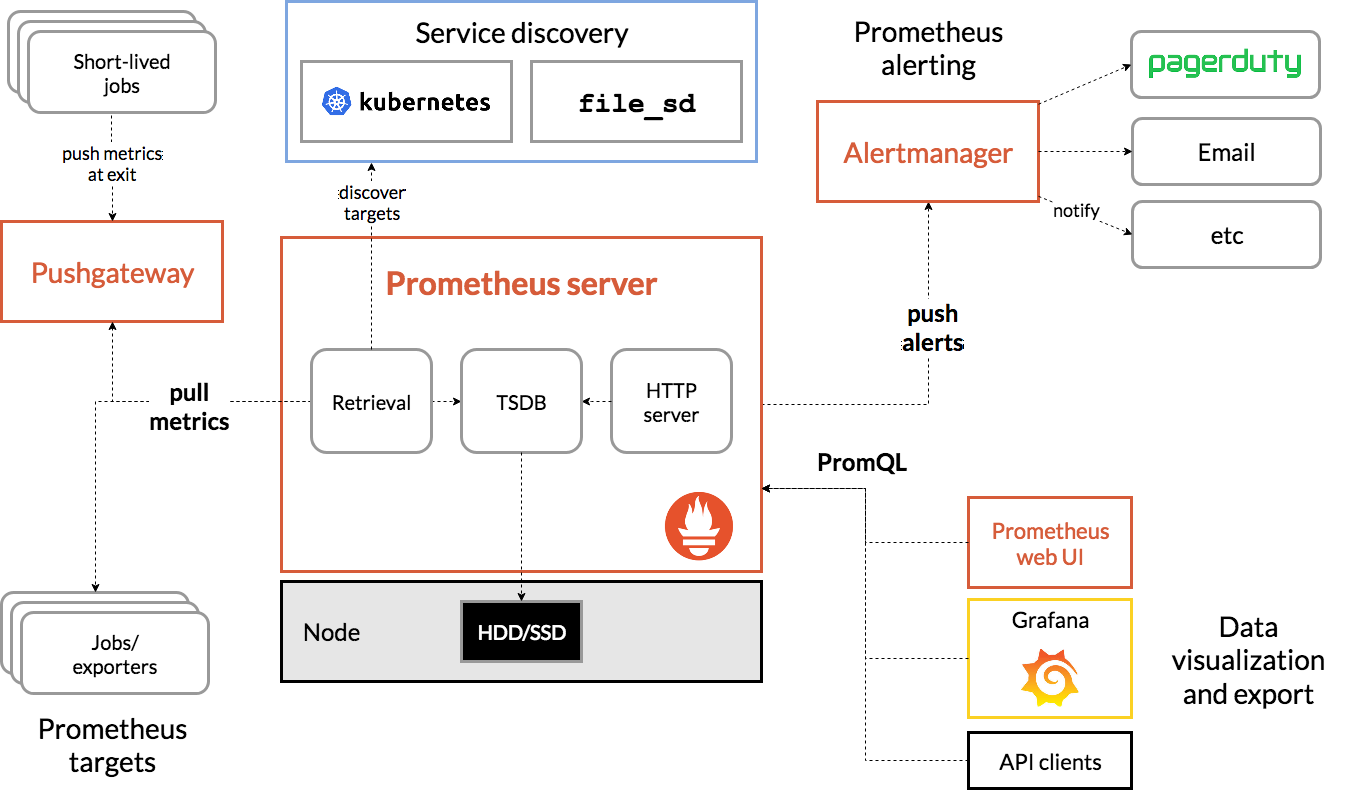
- the main Prometheus server scrapes and stores time series data
- metrics are pulled from instrumented jobs, either directly or via an intermediary push gateway
Configuration
Configuring Prometheus is done with a YAML file. A minimal configuration will usually include:
globalconfiguration optionsscrape_configsdefines targets/service discovery
Service Discovery
The Service Discovery component of Prometheus implements the mechanisms for configuring scrape targets.
The basic file_sd_config is most commonly used, unless you are working with a system that has a supported Service Descovery component such as kubernetes_sd_config or ec2_sd_config.
Storage
Sizing: on average, Prometheus uses only around 1-2 bytes per sample. Rough formula:
needed_disk_space = retention_time_seconds * ingested_samples_per_second * bytes_per_sample
Default storage is local file-based time series database, so limited by space and reliability of local storeage.
The remote write and remote read features of Prometheus allow transparently sending and receiving samples. This is primarily intended for long term storage. It is recommended that you perform careful evaluation of any solution in this space to confirm it can handle your data volumes.
Remote storage integrations allow for:
- write samples that it ingests to a remote URL in a standardized format.
- read (back) sample data from a remote URL in a standardized format
Remote Endpoints and Storage r/w options include:
- Azure Data Explorer: read and write
- Cortex: read and write
- CrateDB: read and write
- InfluxDB: read and write
- IRONdb: read and write
- M3DB: read and write
- PostgreSQL/TimescaleDB: read and write
- Splunk: read and write
- TiKV: read and write
Write-only options add intersting capabilities like global query view, downsampling,
- thanos - global query, unlimited retention, downsampling and compaction (open source)
Metrics
Exposition Formats describes the text format for metrics. Usually these will be generated by an exporter, but it is possible to create by hand.
Each metric is of the form:
# HELP help text to go with the metric
# TYPE metric_name ( counter | gauge | histogram | summary | untyped)
metric_name [
  "{" label_name "=" `"` label_value `"` { "," label_name "=" `"` label_value `"` } [ "," ] "}"
] value [ timestamp ]
Minimalist:
metric_without_timestamp_and_labels 12.47
metric_with_labels_and_timestamp{method="get",code="200"} 1027 1395066363000
Types:
- counter: cumulative metric; value can only increase or be reset to zero on restart
- gauge: single numerical value that can arbitrarily go up and down
- histogram: samples observations (e.g.request durations or response sizes) and counts them in configurable buckets. It also provides a sum and count of all observed values
- summary: Similar to a histogram, it also calculates configurable quantiles over a sliding time window
Counters
Prometheus will not allow counters to decrement. I’ve yet to understand exactly why this must be a constraint.
Visualization
Options:
- built-in expression browser with basic graphic capability - more for ad-hoc queries
- create console templates of pre-defined metrics and graphs
- run a grafana front-end
- send data to an external service that supports visualization, like wavefront.com
- use the API to query data for use in custom solution
PromQL Queries
The built-in expression browser uses PromQL for querying Prometheus.
http://0.0.0.0:9090/graph?g0.range_input=1h&g0.expr=http_requests_total%7Bjob%3D%22demo_targets%22%7D&g0.tab=0
HTTP API
See API docs
Demo
The demonstration setup has:
- Prometheus running in a Docker container, with file-based service discovery
- a “fake” target application built with Sinatra, also running in Docker
Prometheus Demoserver Configuration
demoserver/prometheus.yml- configuration filedemoserver/demo_targets.json- defines service targets, mapped from local file system into the docker container
Configuring Targets
The Sinatra Fake Target (see below) will run on the host IP, and this
needs to be manually updated in demo_targets.json (I haven’t bothered automating this).
First, find your IP e.g.
$ ipconfig getifaddr en0
192.168.1.144
Then update demo_targets.json (the sinatra app runs on port 4567 by default):
...
"targets": [
  "192.168.1.144:4567"
],
...
Prometheus Demoserver Control
The prometheus_control.sh script is a simple wrapper for the main operations:
Startup:
$ ./prometheus_control.sh start
Stopping/removing any previous docker container..
demoserver
demoserver
Starting  prometheus container with web access on port 9090..
dd324bb7306a45a0b7d59b6ce4da7416984140188efdff9ec42acdd272029ec9
Shutdown:
$ ./prometheus_control.sh stop
Stopping/removing any previous docker container..
demoserver
demoserver
Sinatra Fake Target
The sinatra_target folder has a simple Sinatra (ruby) application that acts as a fake target for Prometheus.
It has a /metrics endpoint that emits some counters and gauges based on GC stats.
It’s OK to run the app locally if you have a working ruby/rvm environment:
$ cd sinatra_target
$ gem install bundler
$ bundle install
$ ruby app.rb
== Sinatra (v2.0.1) has taken the stage on 4567 for development with backup from Thin
Thin web server (v1.7.2 codename Bachmanity)
Maximum connections set to 1024
Listening on 0.0.0.0:4567, CTRL+C to stop
However for the demo, I’m running it in Docker.
Build the image (needs to be repeated if the application code is changed):
$ docker-compose build
(...etc...)
Successfully built 6ed5b0733dc3
Successfully tagged sinatra_target_web:latest
Startup:
$ docker-compose up
Creating network "sinatra_target_default" with the default driver
Creating sinatra_target_web_1 ... done
Attaching to sinatra_target_web_1
web_1  | == Sinatra (v2.0.1) has taken the stage on 4567 for development with backup from Thin
..
Or to run in the background:
$ docker-compose up -d
Starting sinatra_target_web_1 ... done
$ docker-compose logs
Attaching to sinatra_target_web_1
web_1  | == Sinatra (v2.0.1) has taken the stage on 4567 for development with backup from Thin

$ docker-compose down
Stopping sinatra_target_web_1 ... done
Removing sinatra_target_web_1 ... done
Removing network sinatra_target_default
Testing the Sinatra App
It should be responding with metrics on port 4567:
$ curl http://0.0.0.0:4567/metrics
# HELP http_requests_total The total number of HTTP requests.
# TYPE http_requests_total counter
http_requests_total{app="sinatra_target",method="get",code="200"} 2 1573708711850

# HELP gc_heap_slots_count Current GC heap slots.
# TYPE gc_heap_slots_count gauge
gc_heap_slots_count{app="sinatra_target",status="available"} 96191 1573708711850
gc_heap_slots_count{app="sinatra_target",status="live"} 51556 1573708711850
gc_heap_slots_count{app="sinatra_target",status="free"} 44635 1573708711850
gc_heap_slots_count{app="sinatra_target",status="final"} 0 1573708711850
gc_heap_slots_count{app="sinatra_target",status="marked"} 41649 1573708711850

# HELP gc_objects_total Total GC object operations.
# TYPE gc_objects_total counter
gc_objects_total{app="sinatra_target",status="allocated"} 309466 1573708711850
gc_objects_total{app="sinatra_target",status="freed"} 257910 1573708711850

# HELP gc_pages_total Total GC page operations.
# TYPE gc_pages_total counter
gc_pages_total{app="sinatra_target",status="allocated"} 236 1573708711850
gc_pages_total{app="sinatra_target",status="freed"} 0 1573708711850
Browse to http://0.0.0.0:4567 for a simple web interface to the app.
I used sinatra_target/fake_load.sh script to send some load at the server to make GC do some work.
Examining Results in Prometheus
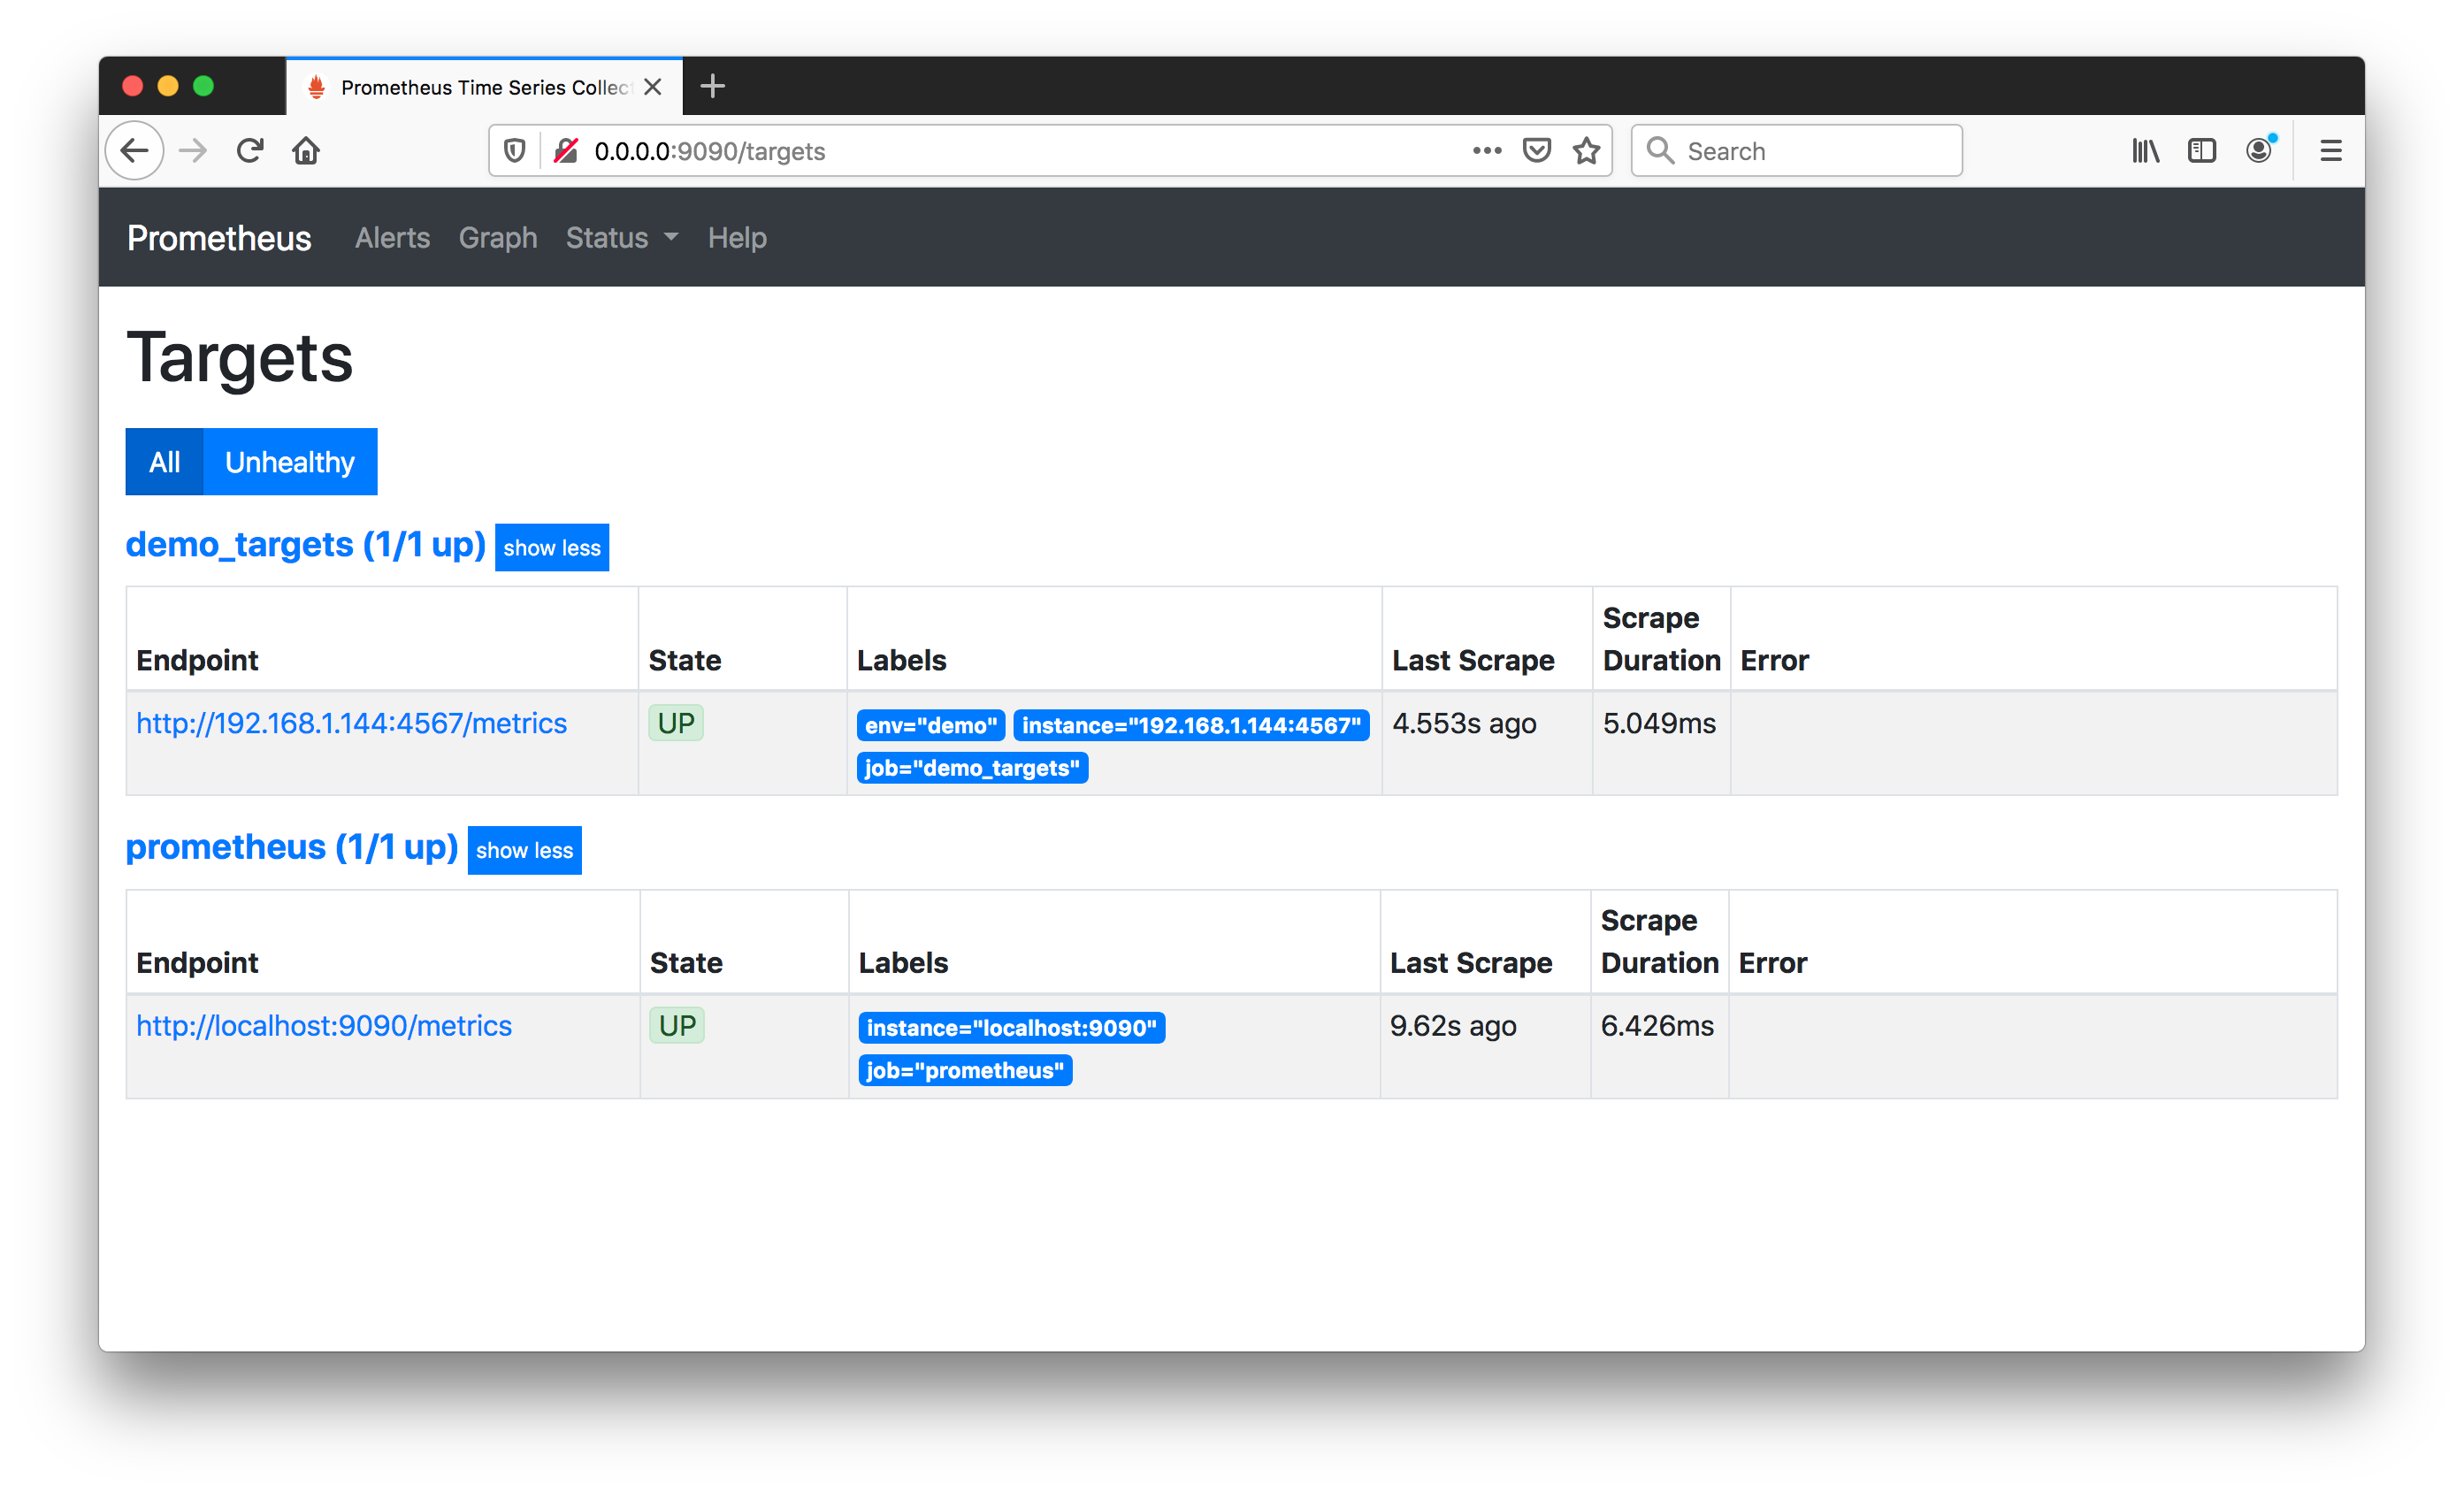
The prometheus web interface is running on http://0.0.0.0:9090/ by default.
Two targets show up - the prometheus server itself, and also the fake sinatra app:
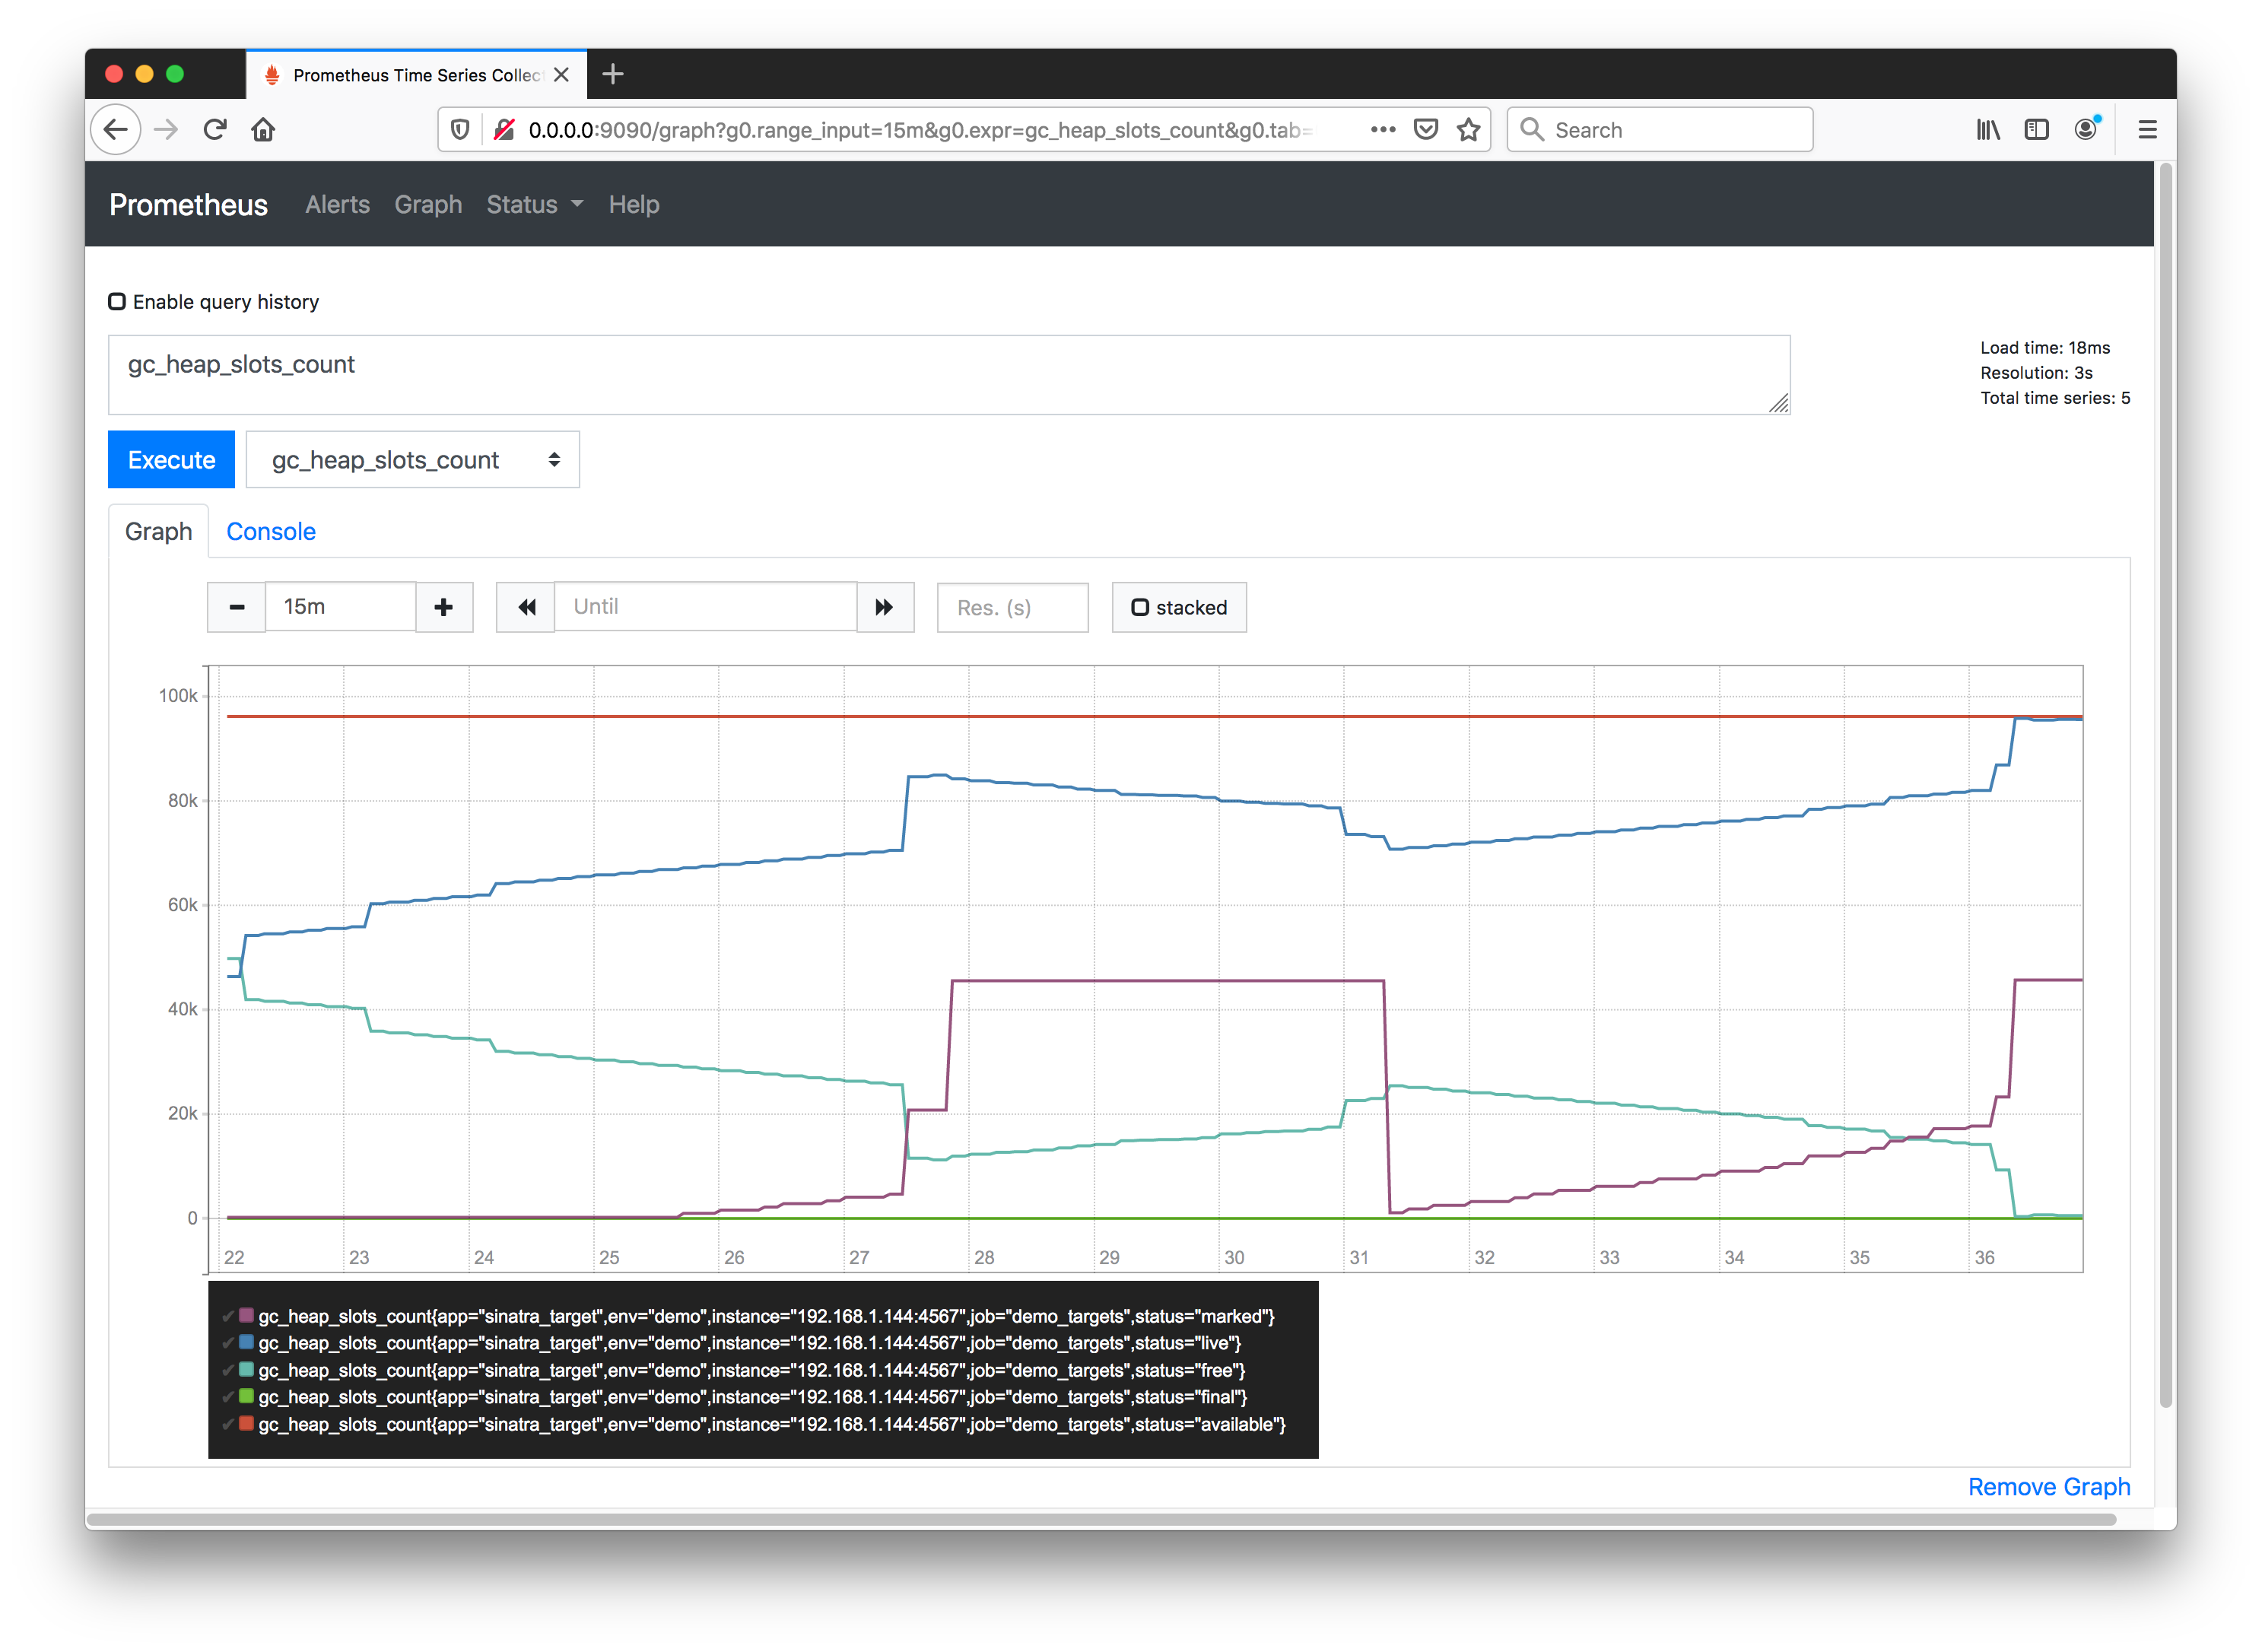
GC Stats - Heap Slots
Heap slots are collected from the Sinatra application as a guage with a status dimension to distinguish (available | live | free | final | marked).
The guage metric is used, since these values represent the current heap state and can go up and down.
Examining some calculations we can get Prometheus to perform on guage data..
The delta function calculates the difference between the first and last value in each time period, for example over 5m time blocks:
delta(gc_heap_slots_count[5m])

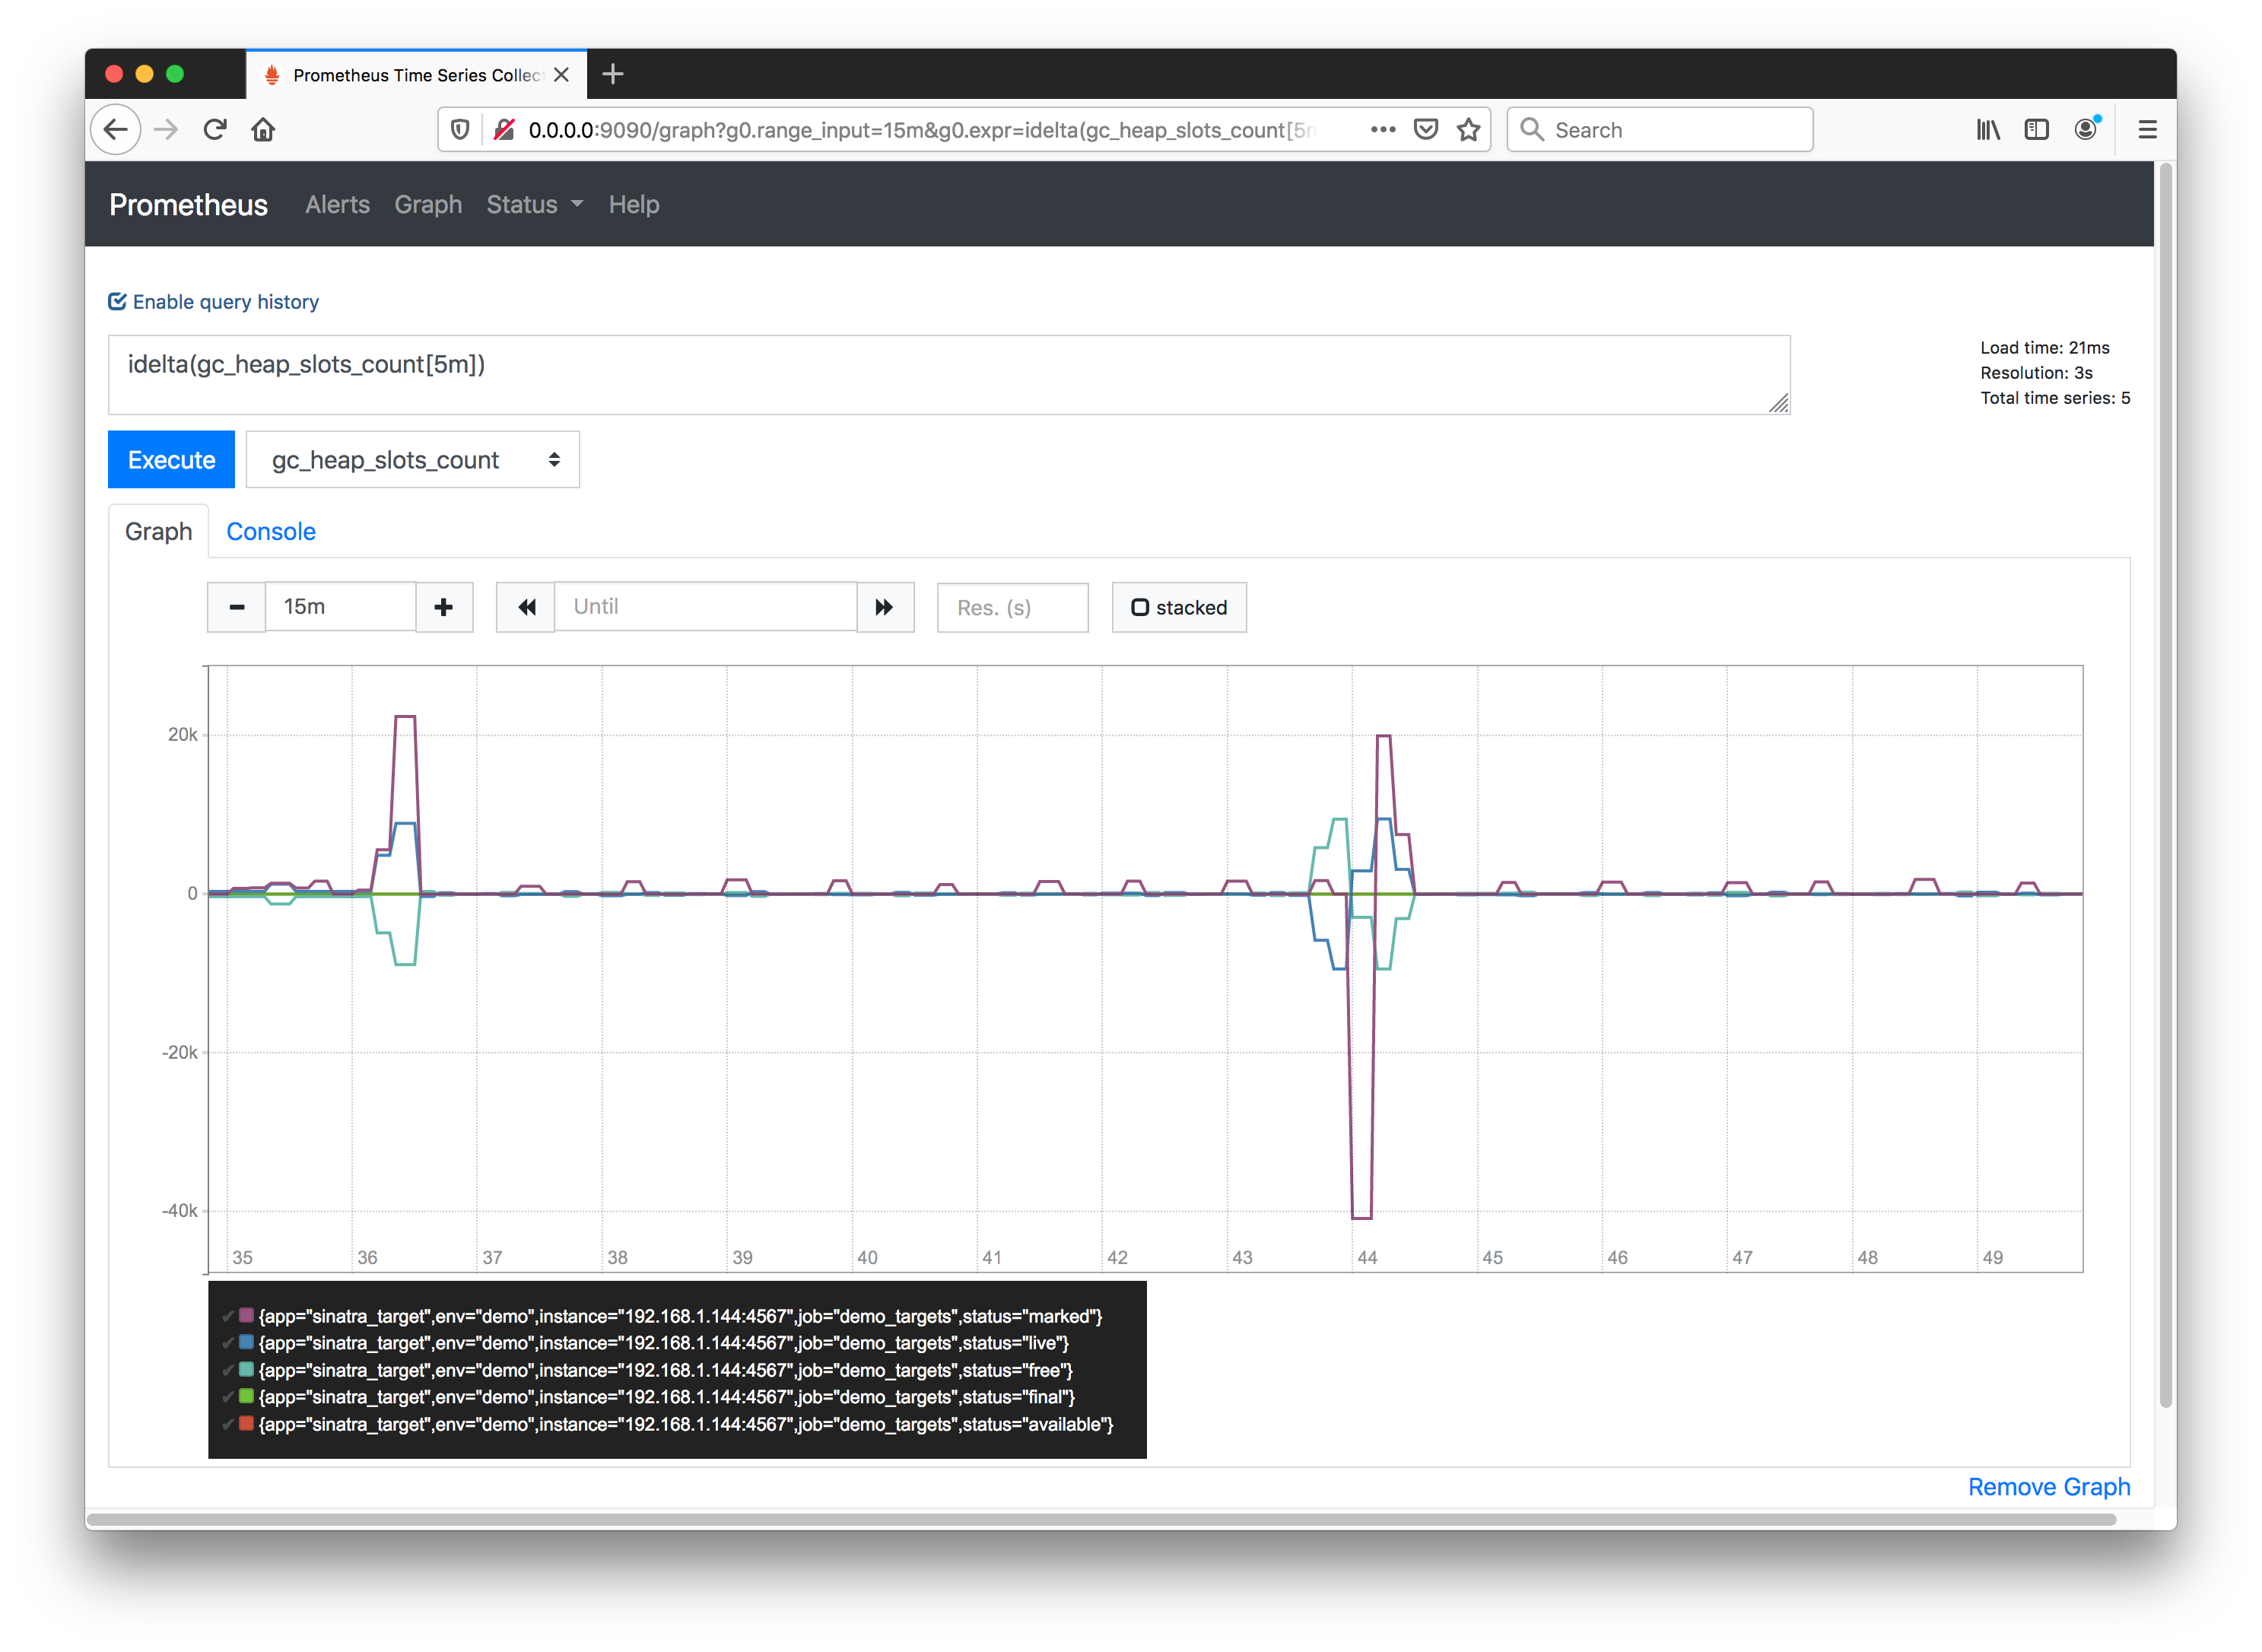
The idelta function calculates the difference between the last two samples, for example over 5m time blocks:
idelta(gc_heap_slots_count[5m])
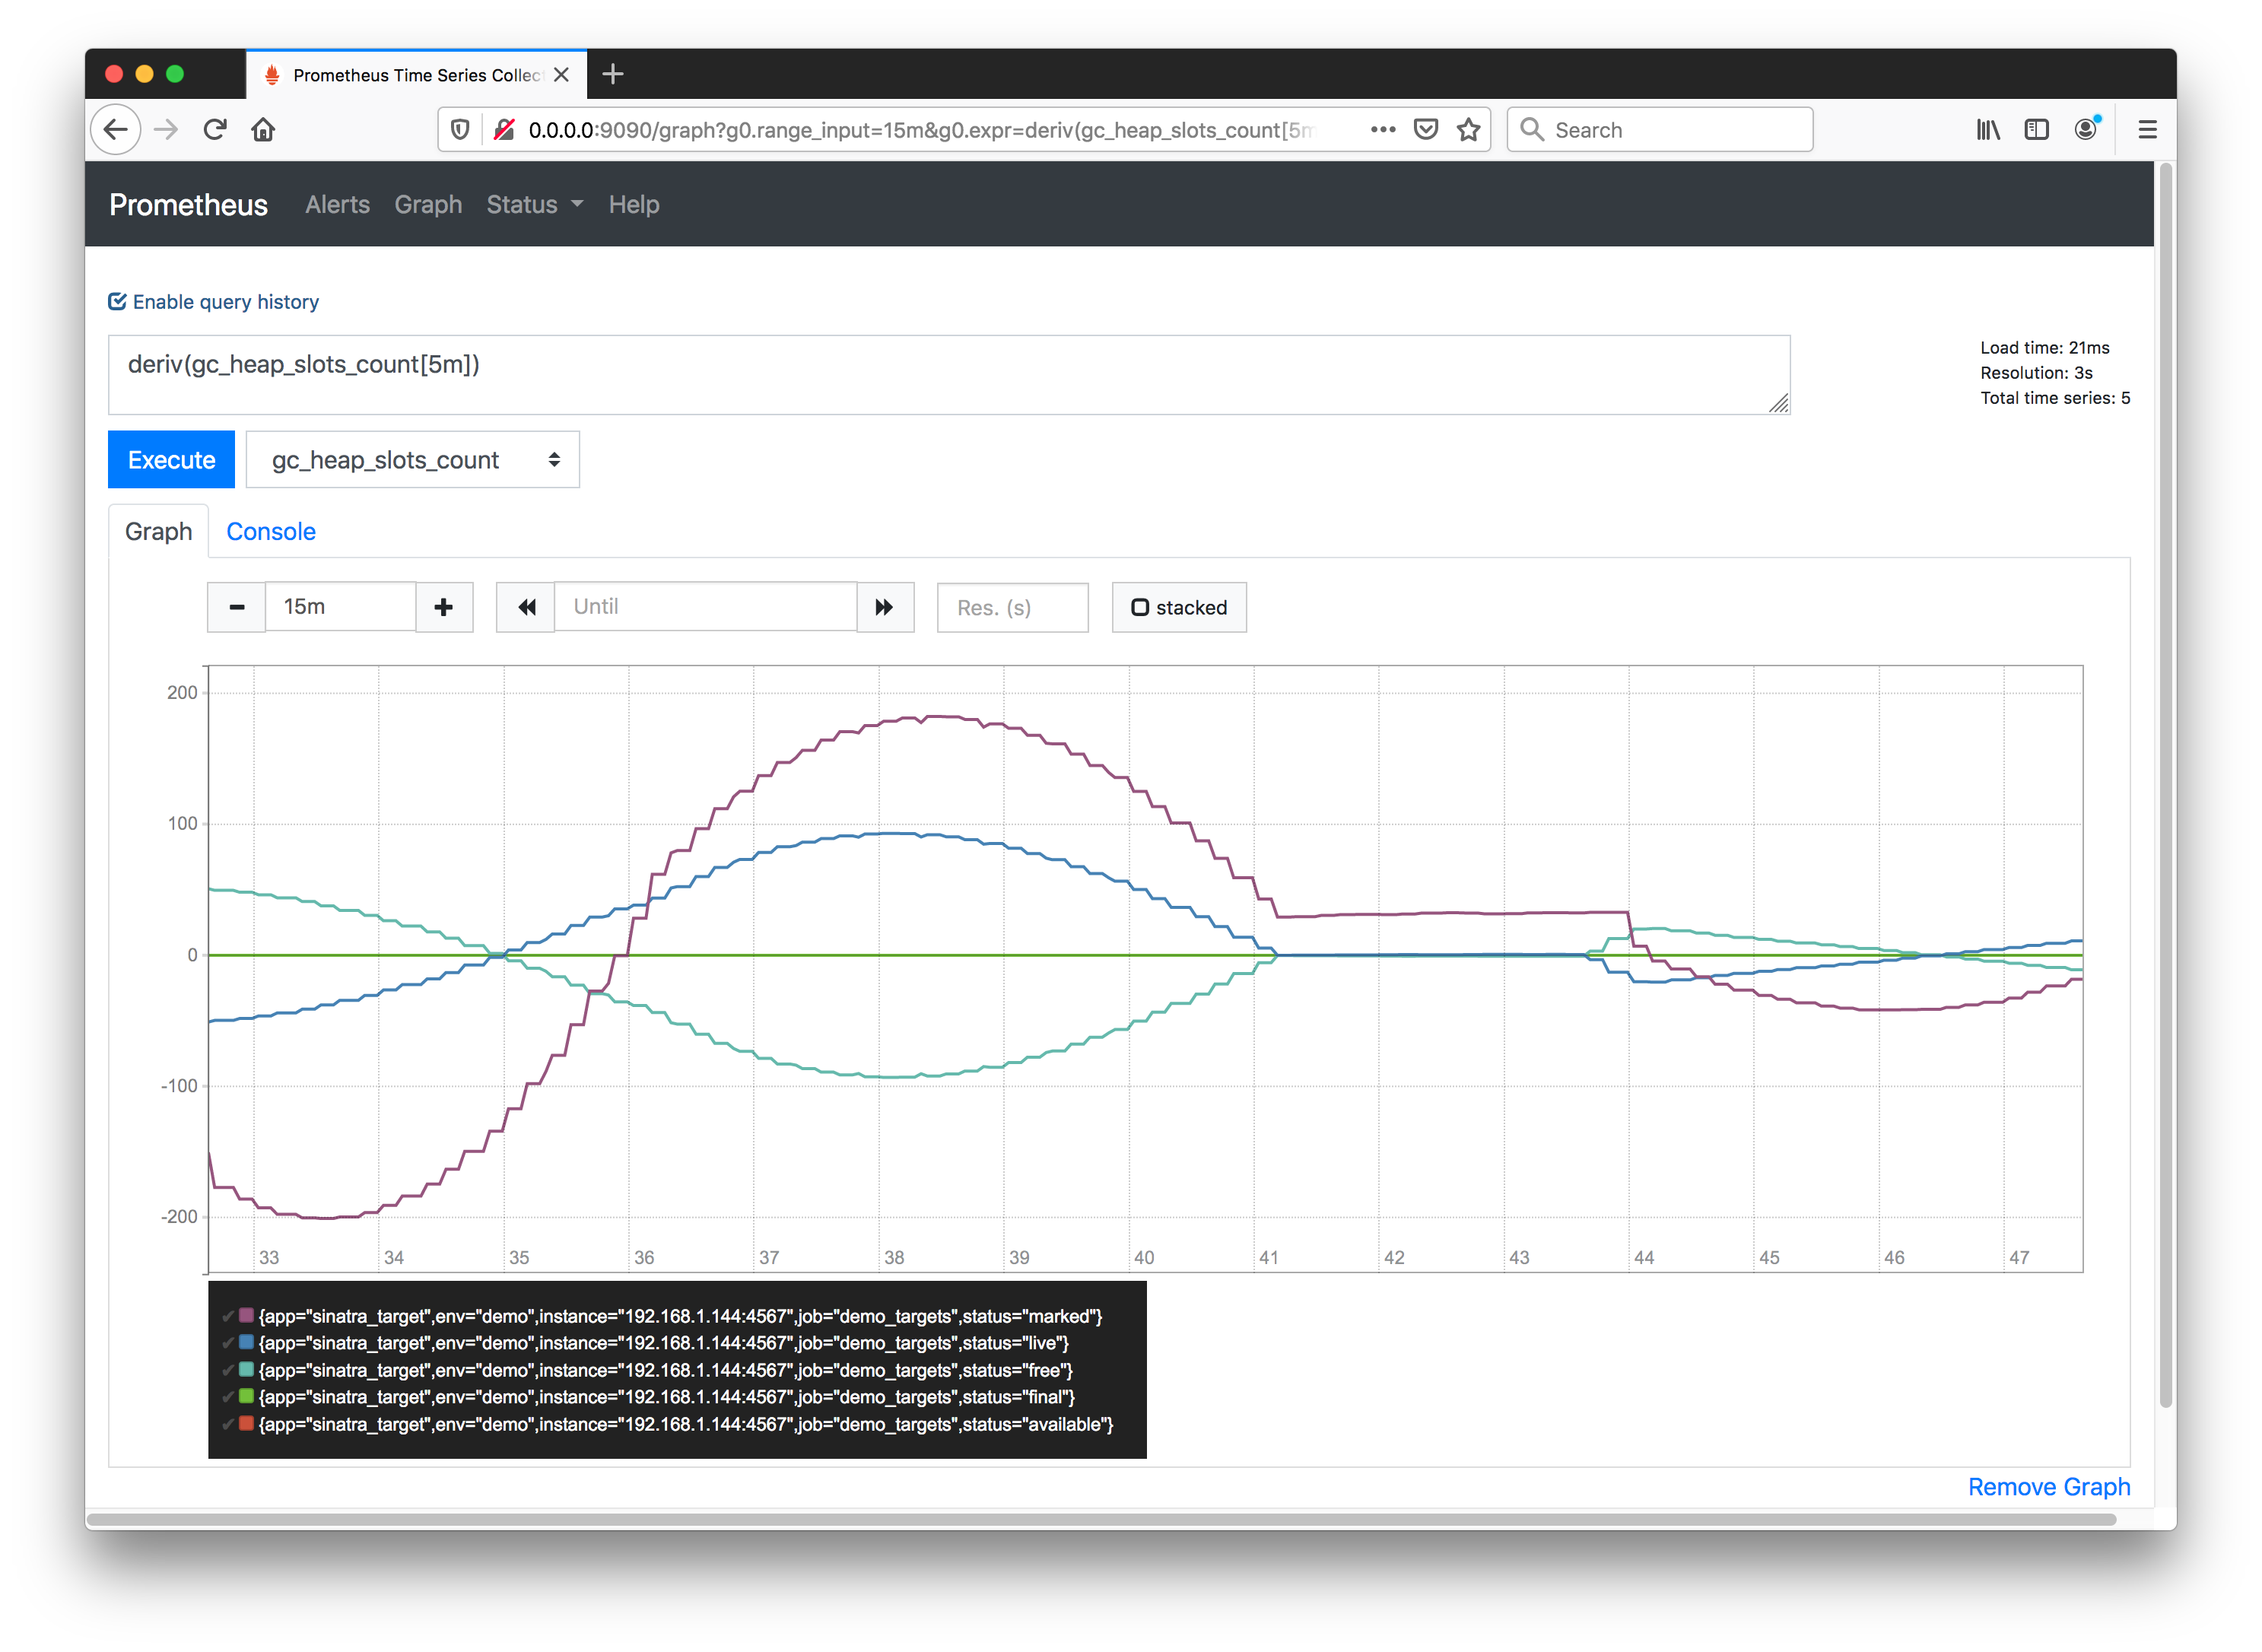
The deriv function is the per-second derivative of the time series, for example over 5m time blocks:
deriv(gc_heap_slots_count[5m])
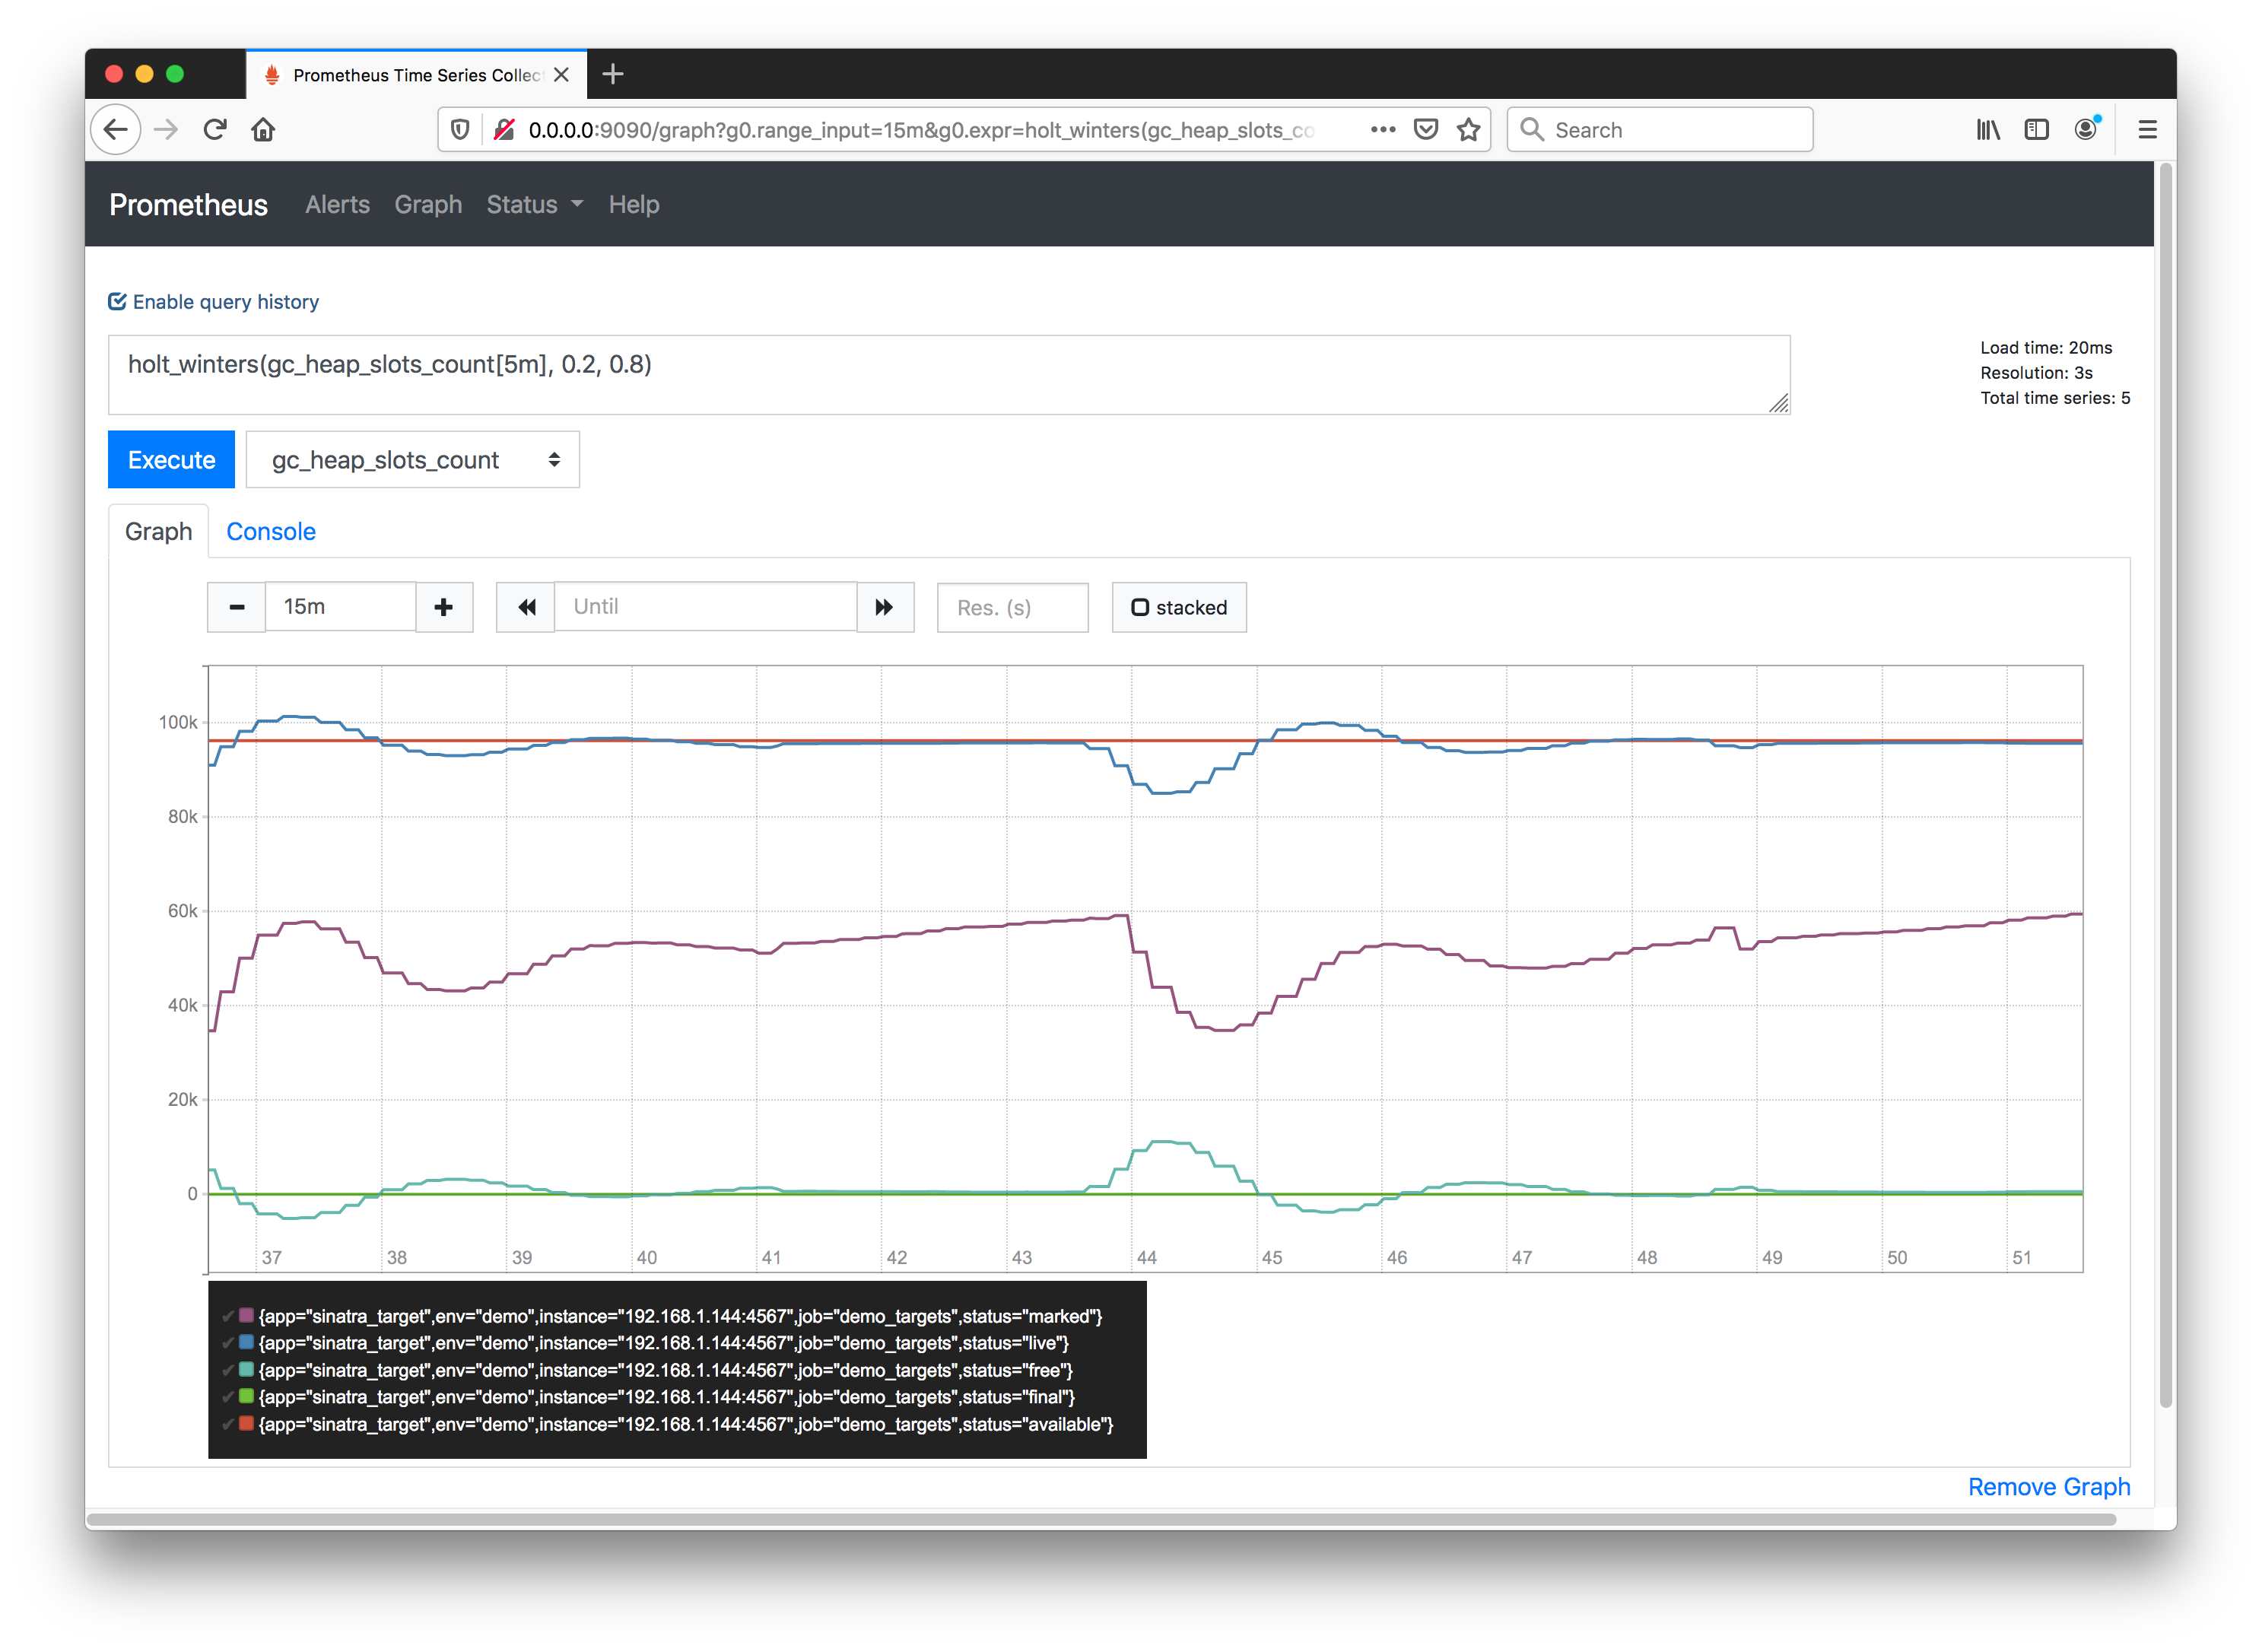
The holt_winters function produces a smoothed value for time series, for example over 5m time blocks with smoothing factor 0.2 and trend factor 0.8:
holt_winters(gc_heap_slots_count[5m], 0.2, 0.8)
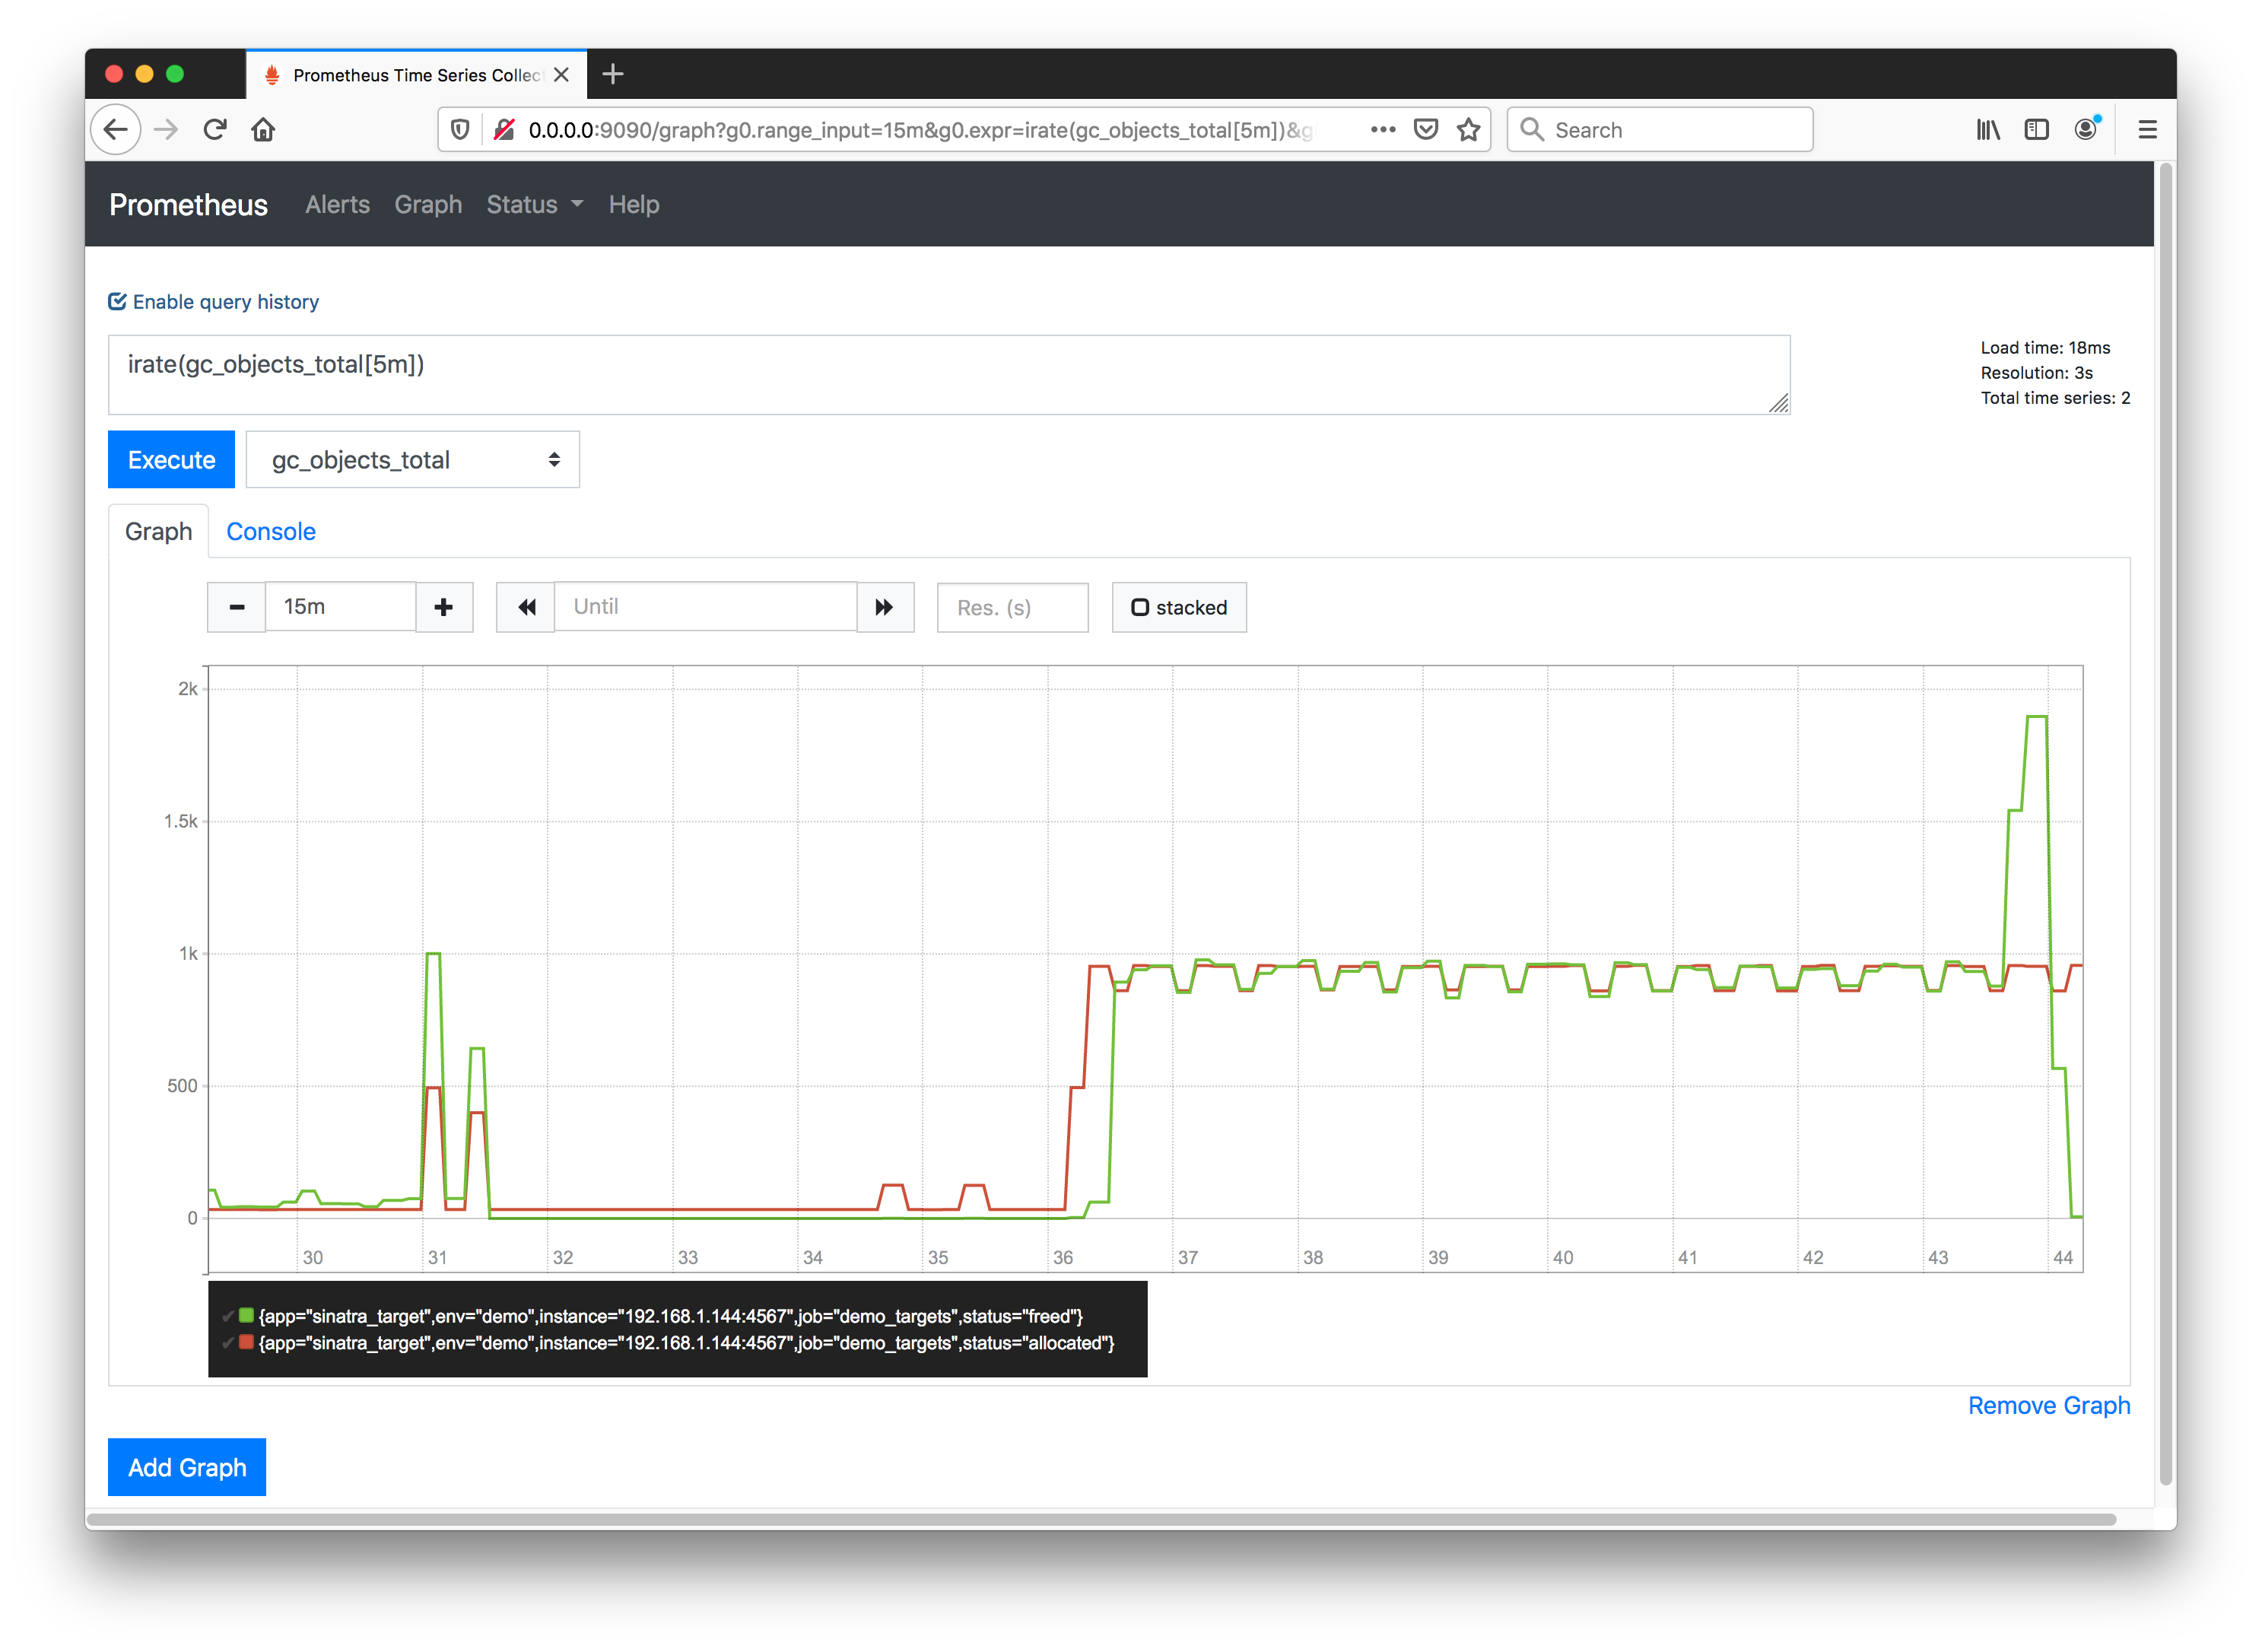
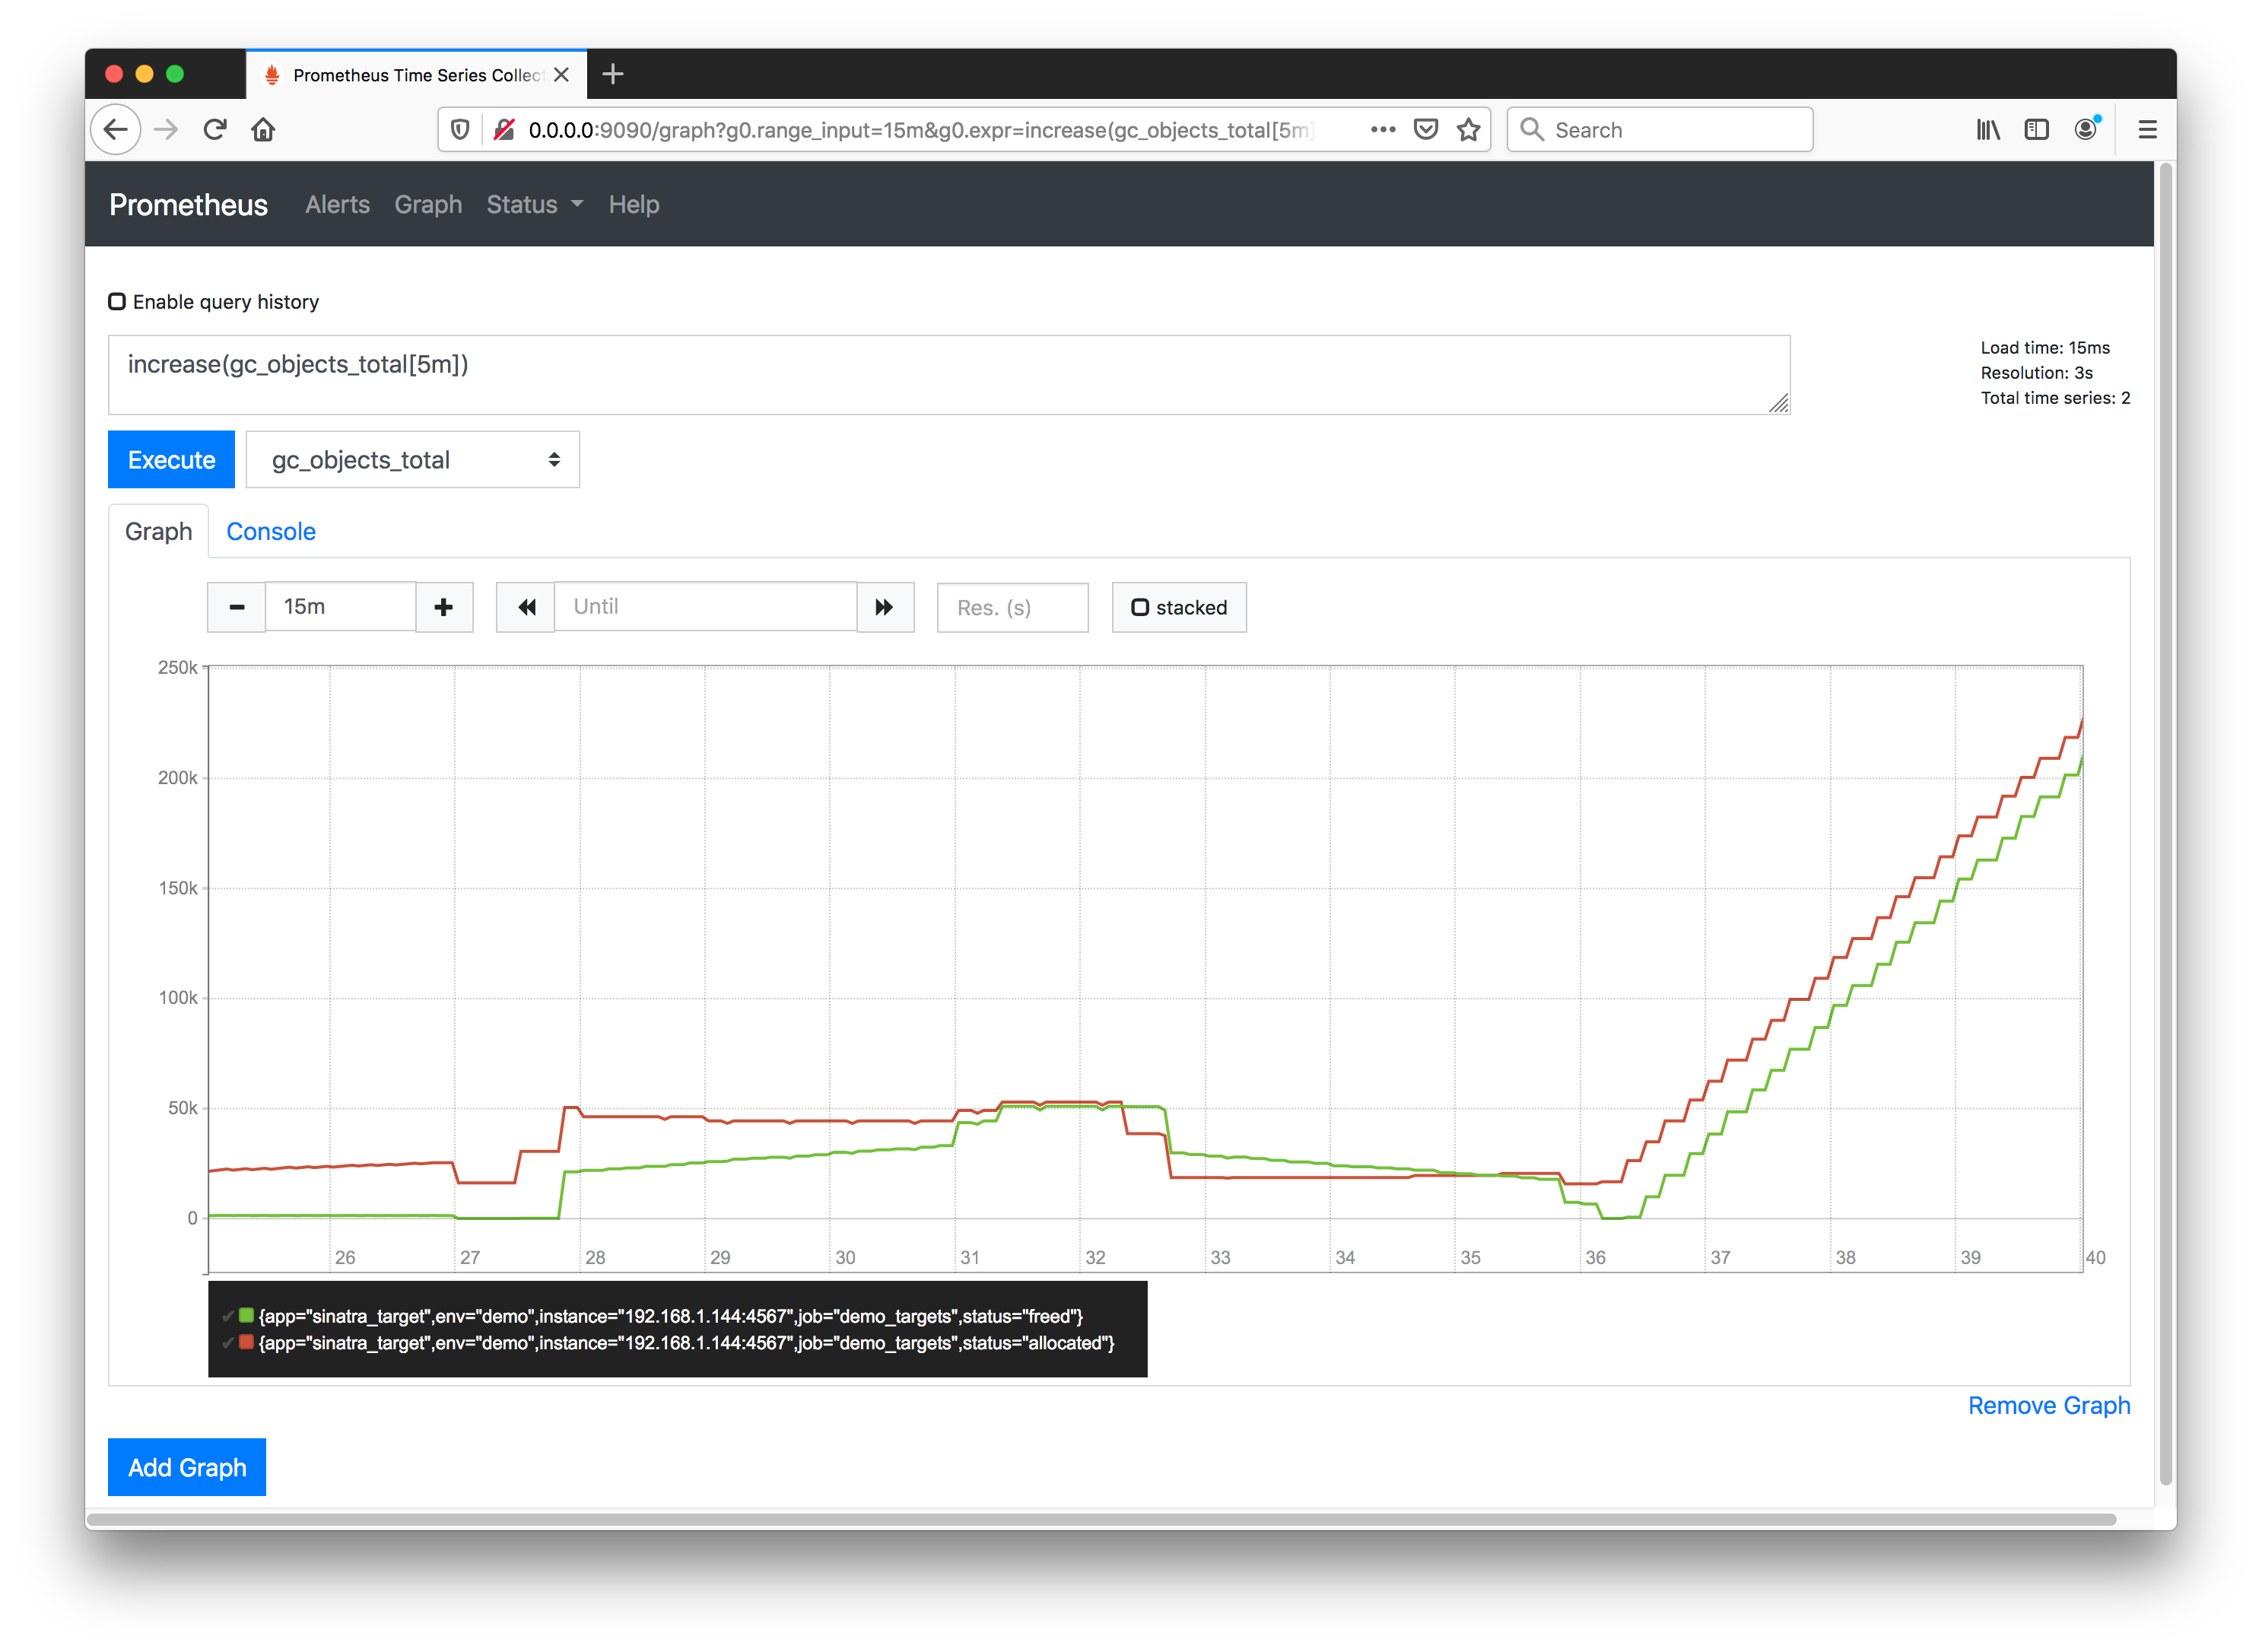
GC Stats - Objects Total
GC objects collected from the Sinatra application as a counter with a status dimension to distinguish (allocated | freed).
The counter metric is used, since these values represent the total over time and only go up (at least, for the life of the current process).
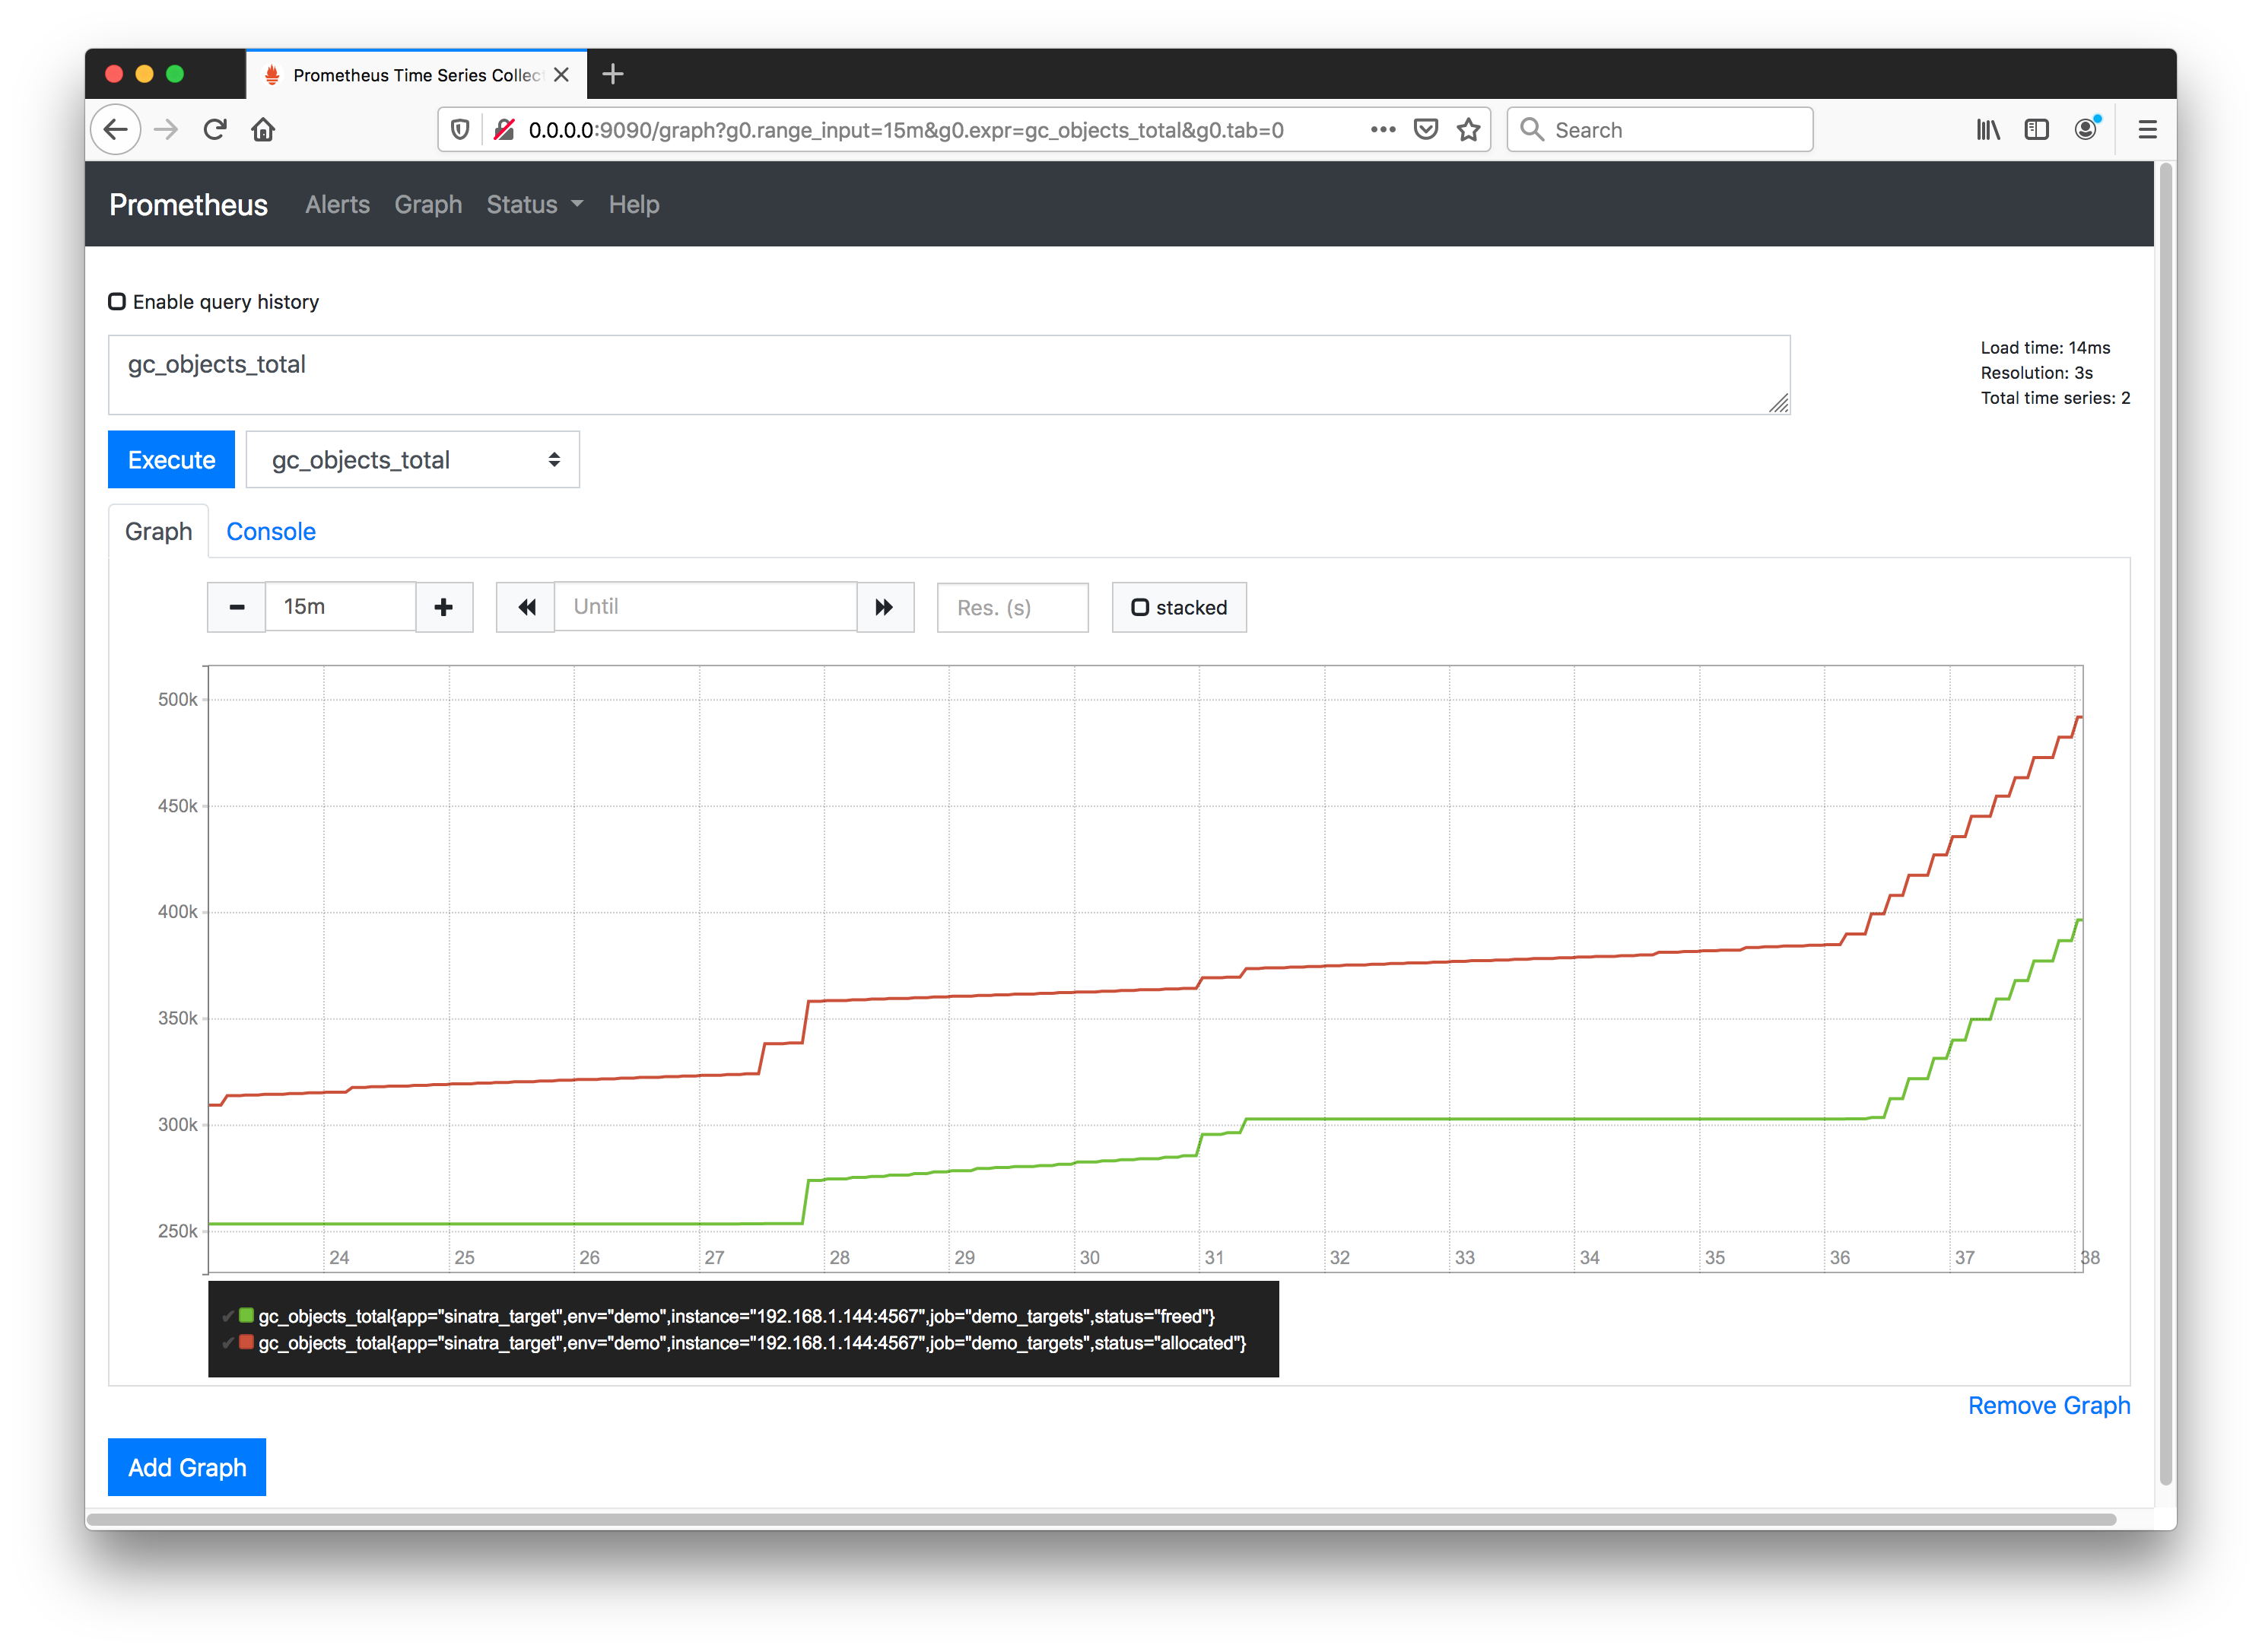
Examining some calculations we can get Prometheus to perform on counter data..
The increase function calculates the increase in the time series in the range vector, for example over 5m time blocks:
increase(gc_objects_total[5m])
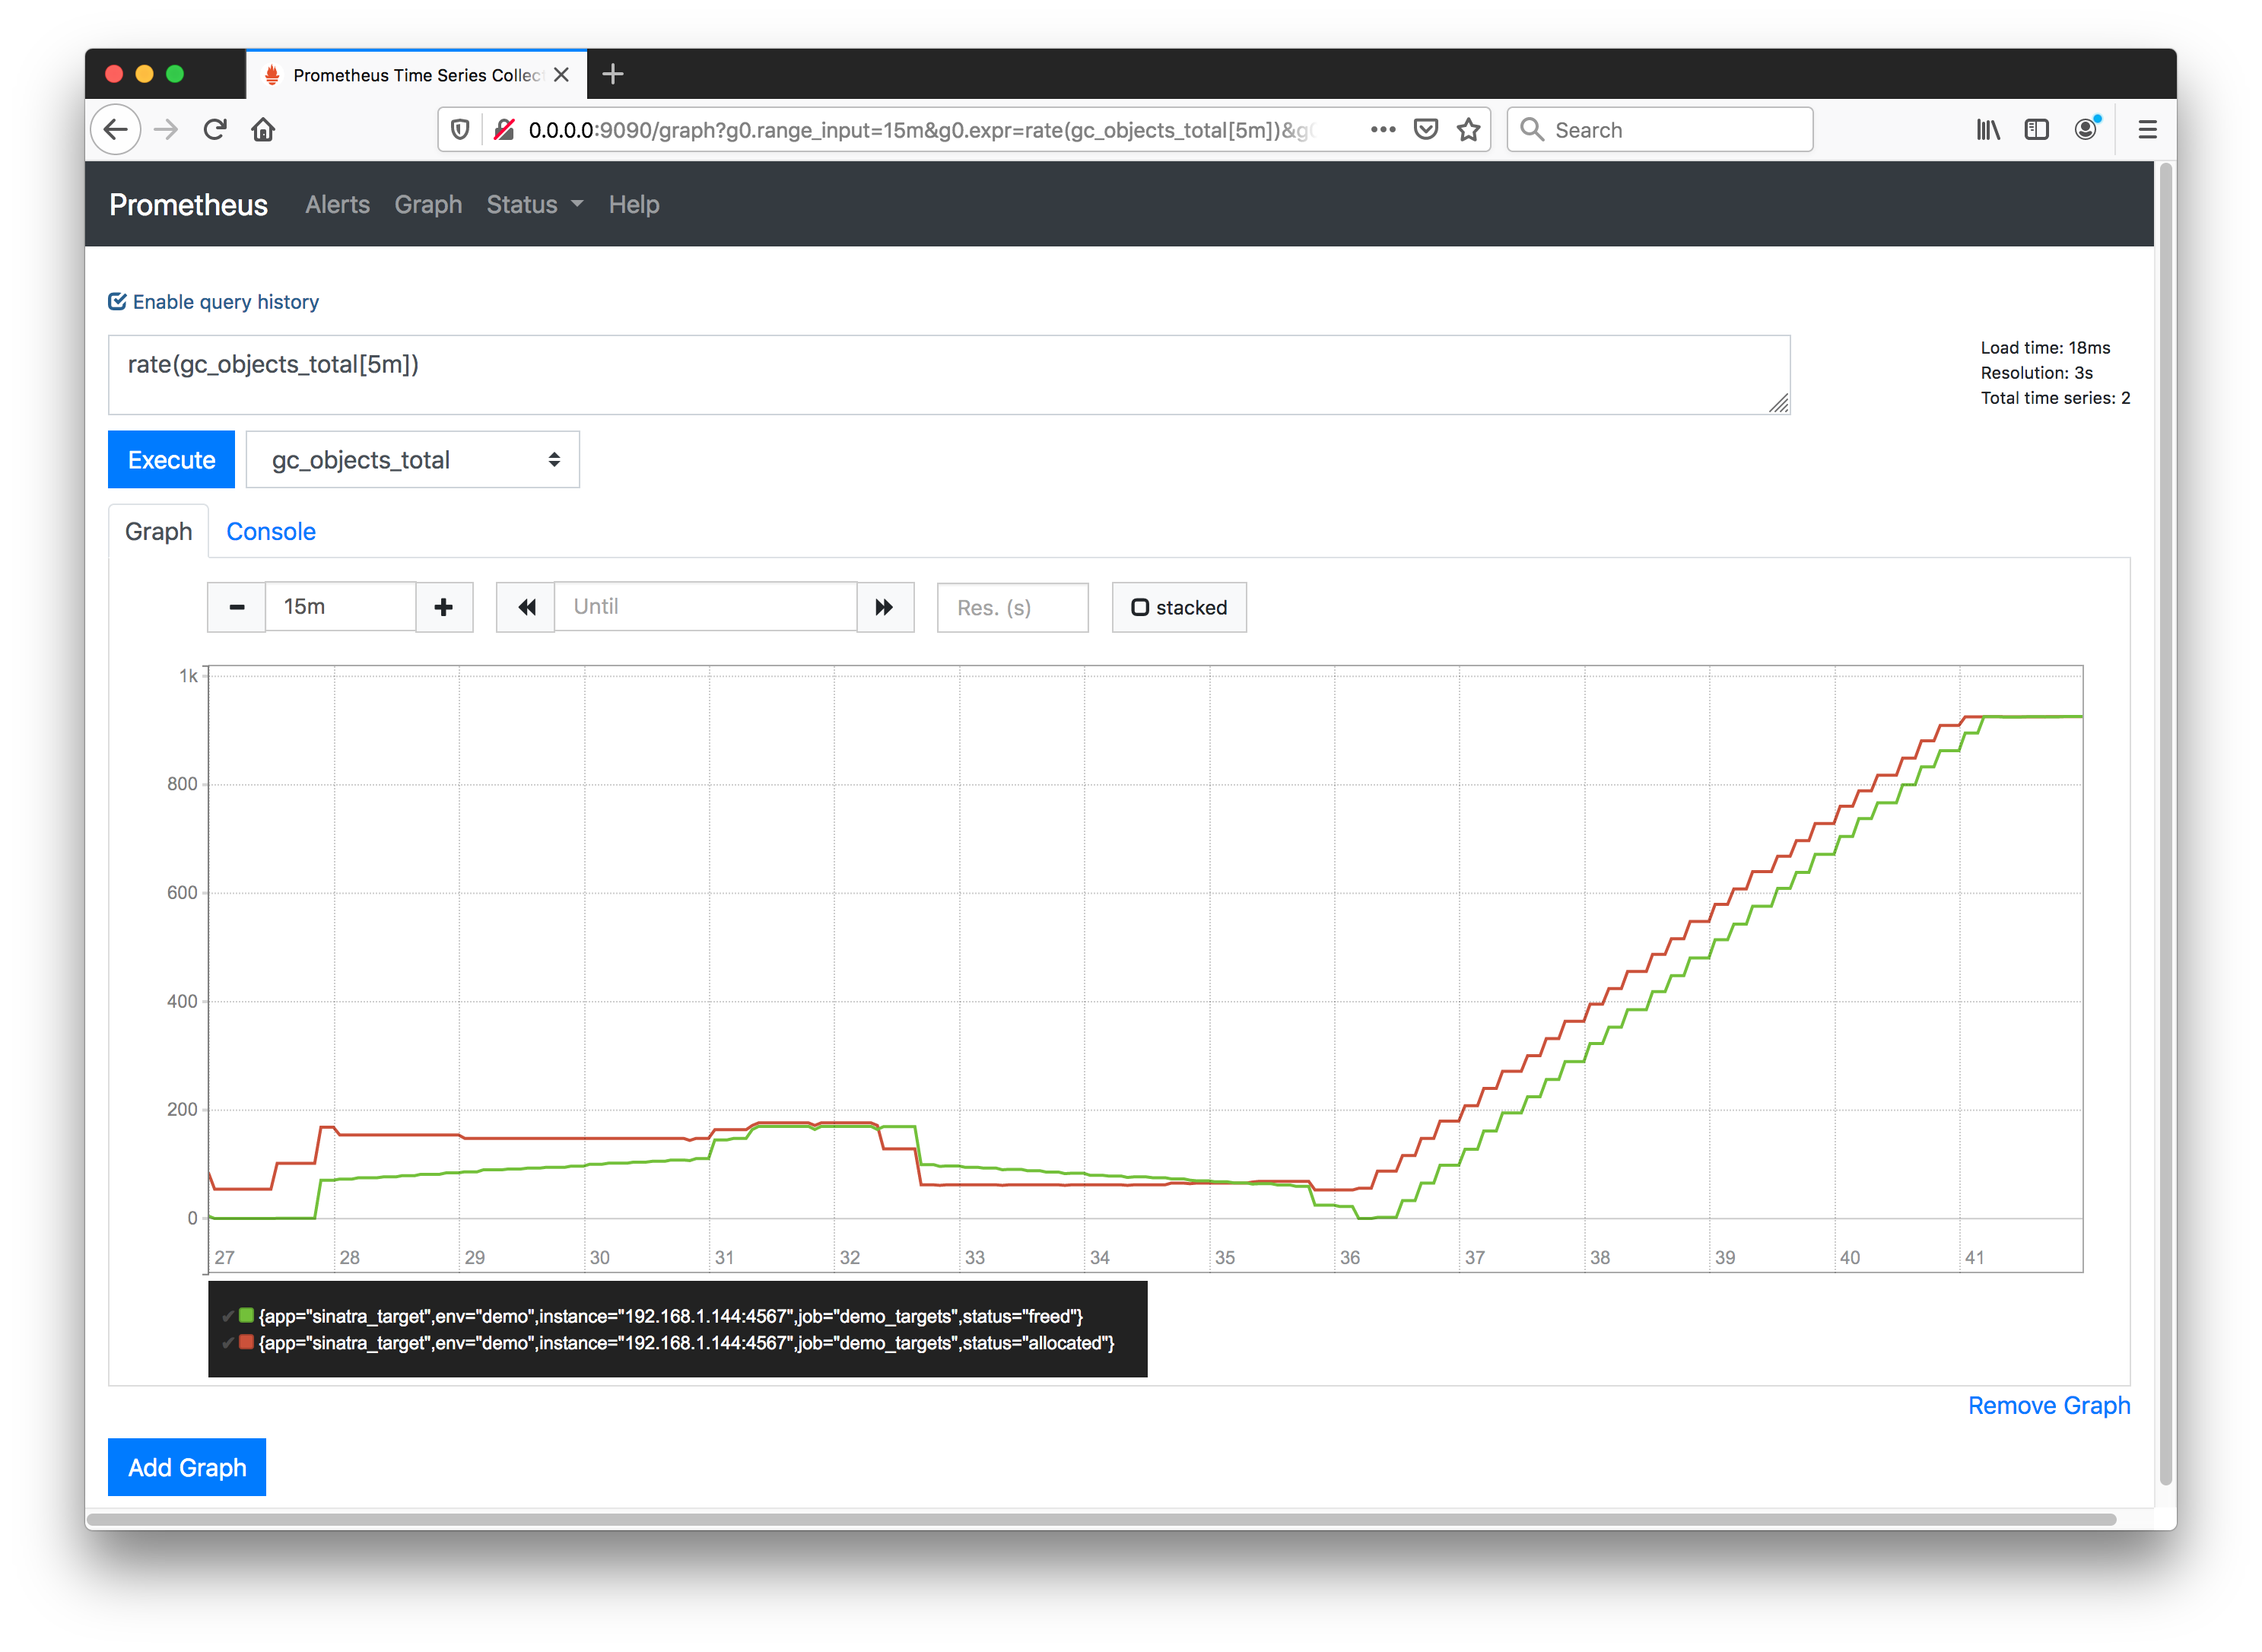
The rate function calculates the per-second average rate of increase of the time series, for example over 5m time blocks:
rate(gc_objects_total[5m])
The irate function calculates the per-second instant rate of increase of the time series, for example over 5m time blocks:
irate(gc_objects_total[5m])