#084 Chart Basics
Getting up and running and understanding the latest from Google Charts
Notes
Google Charts has come a long way from doing simple inline line charts. My bottom line:
Positives:
- well designed API
- very good documentation
- quite extensive capabilities
Negatives:
- not available for offline or stand-alone packaging and distribution
Loading Charts Library
Loading
<script type="text/javascript" src="https://www.gstatic.com/charts/loader.js"></script>
<script type="text/javascript">
  google.charts.load('current', {packages: ['corechart']});
  google.charts.setOnLoadCallback(drawChart);
  ...
</script>
Unlike other libraries, Google Charts is not released for stand-alone packaging and distribution. This may eliminate it as an option for some scenarios like content serving behind restrictive firewalls or over poor wide-area networks. From the FAQ:
Our terms of service do not allow you to download the google.charts.load or google.visualization code to use offline.
Making a Chart Dynamic
The DataTable class provides all
the methods you need to update the data to be visualised. Calling draw(data, options) on the chart will update the data and
also let’s one change options too.
It seems inefficient (but presumably internally optimised?) but works just fine.
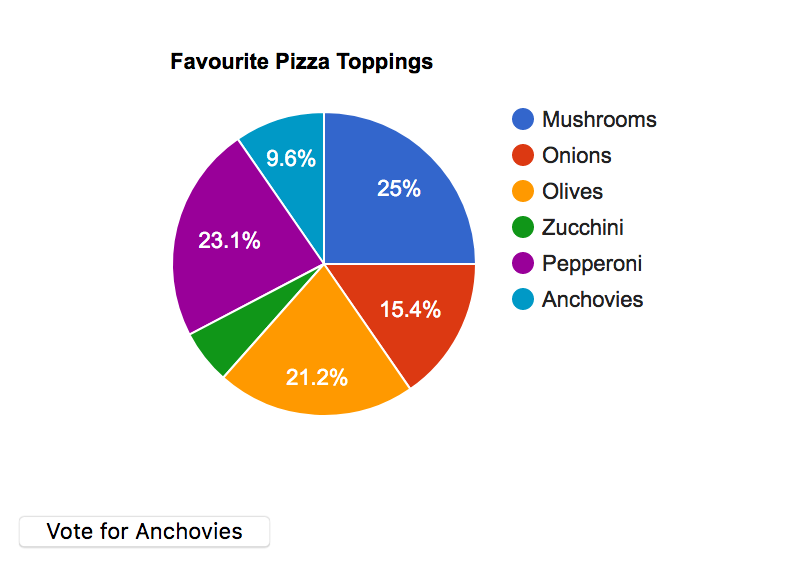
Quite Test: Pie Chart
See example_pie.html

