#114 Rickshaw
Testing out the D3-based Rickshaw time series graph library
Notes
Rickshaw is:
- a JavaScript toolkit for creating interactive time series graphs
- built on d3.js
- open source (MIT license)
- developed at Shutterstock
- available on CDN (cdnjs)
See also:
Installation Options
- download compiled sources from github
- install with bower
bower install rickshaw - install with npm
npm install --save rickshaw - direct from CDN (cdnjs)
Using a CDN
Requires:
e.g.
<link rel="stylesheet" href="https://cdnjs.cloudflare.com/ajax/libs/rickshaw/1.6.6/rickshaw.css" integrity="sha256-3vAiod7sePtPgQYpPMFvmDNLWVbCeYiEjb9p4lt3PXQ=" crossorigin="anonymous" />
<script src="https://cdnjs.cloudflare.com/ajax/libs/d3/3.5.16/d3.min.js" integrity="sha256-uB5nPcWK8vr5e83snqtMUYJ2n/5TZ3PV9CCRk1pzob4=" crossorigin="anonymous"></script>
<script src="https://cdnjs.cloudflare.com/ajax/libs/rickshaw/1.6.6/rickshaw.js" integrity="sha256-F4WIKaQsZ/uUDfd1G2srG7DoLrveN3Q4LoaQ+4RI/PQ=" crossorigin="anonymous"></script>
<script src="https://ajax.googleapis.com/ajax/libs/jquery/1.8.1/jquery.min.js"></script>
Quick Demo
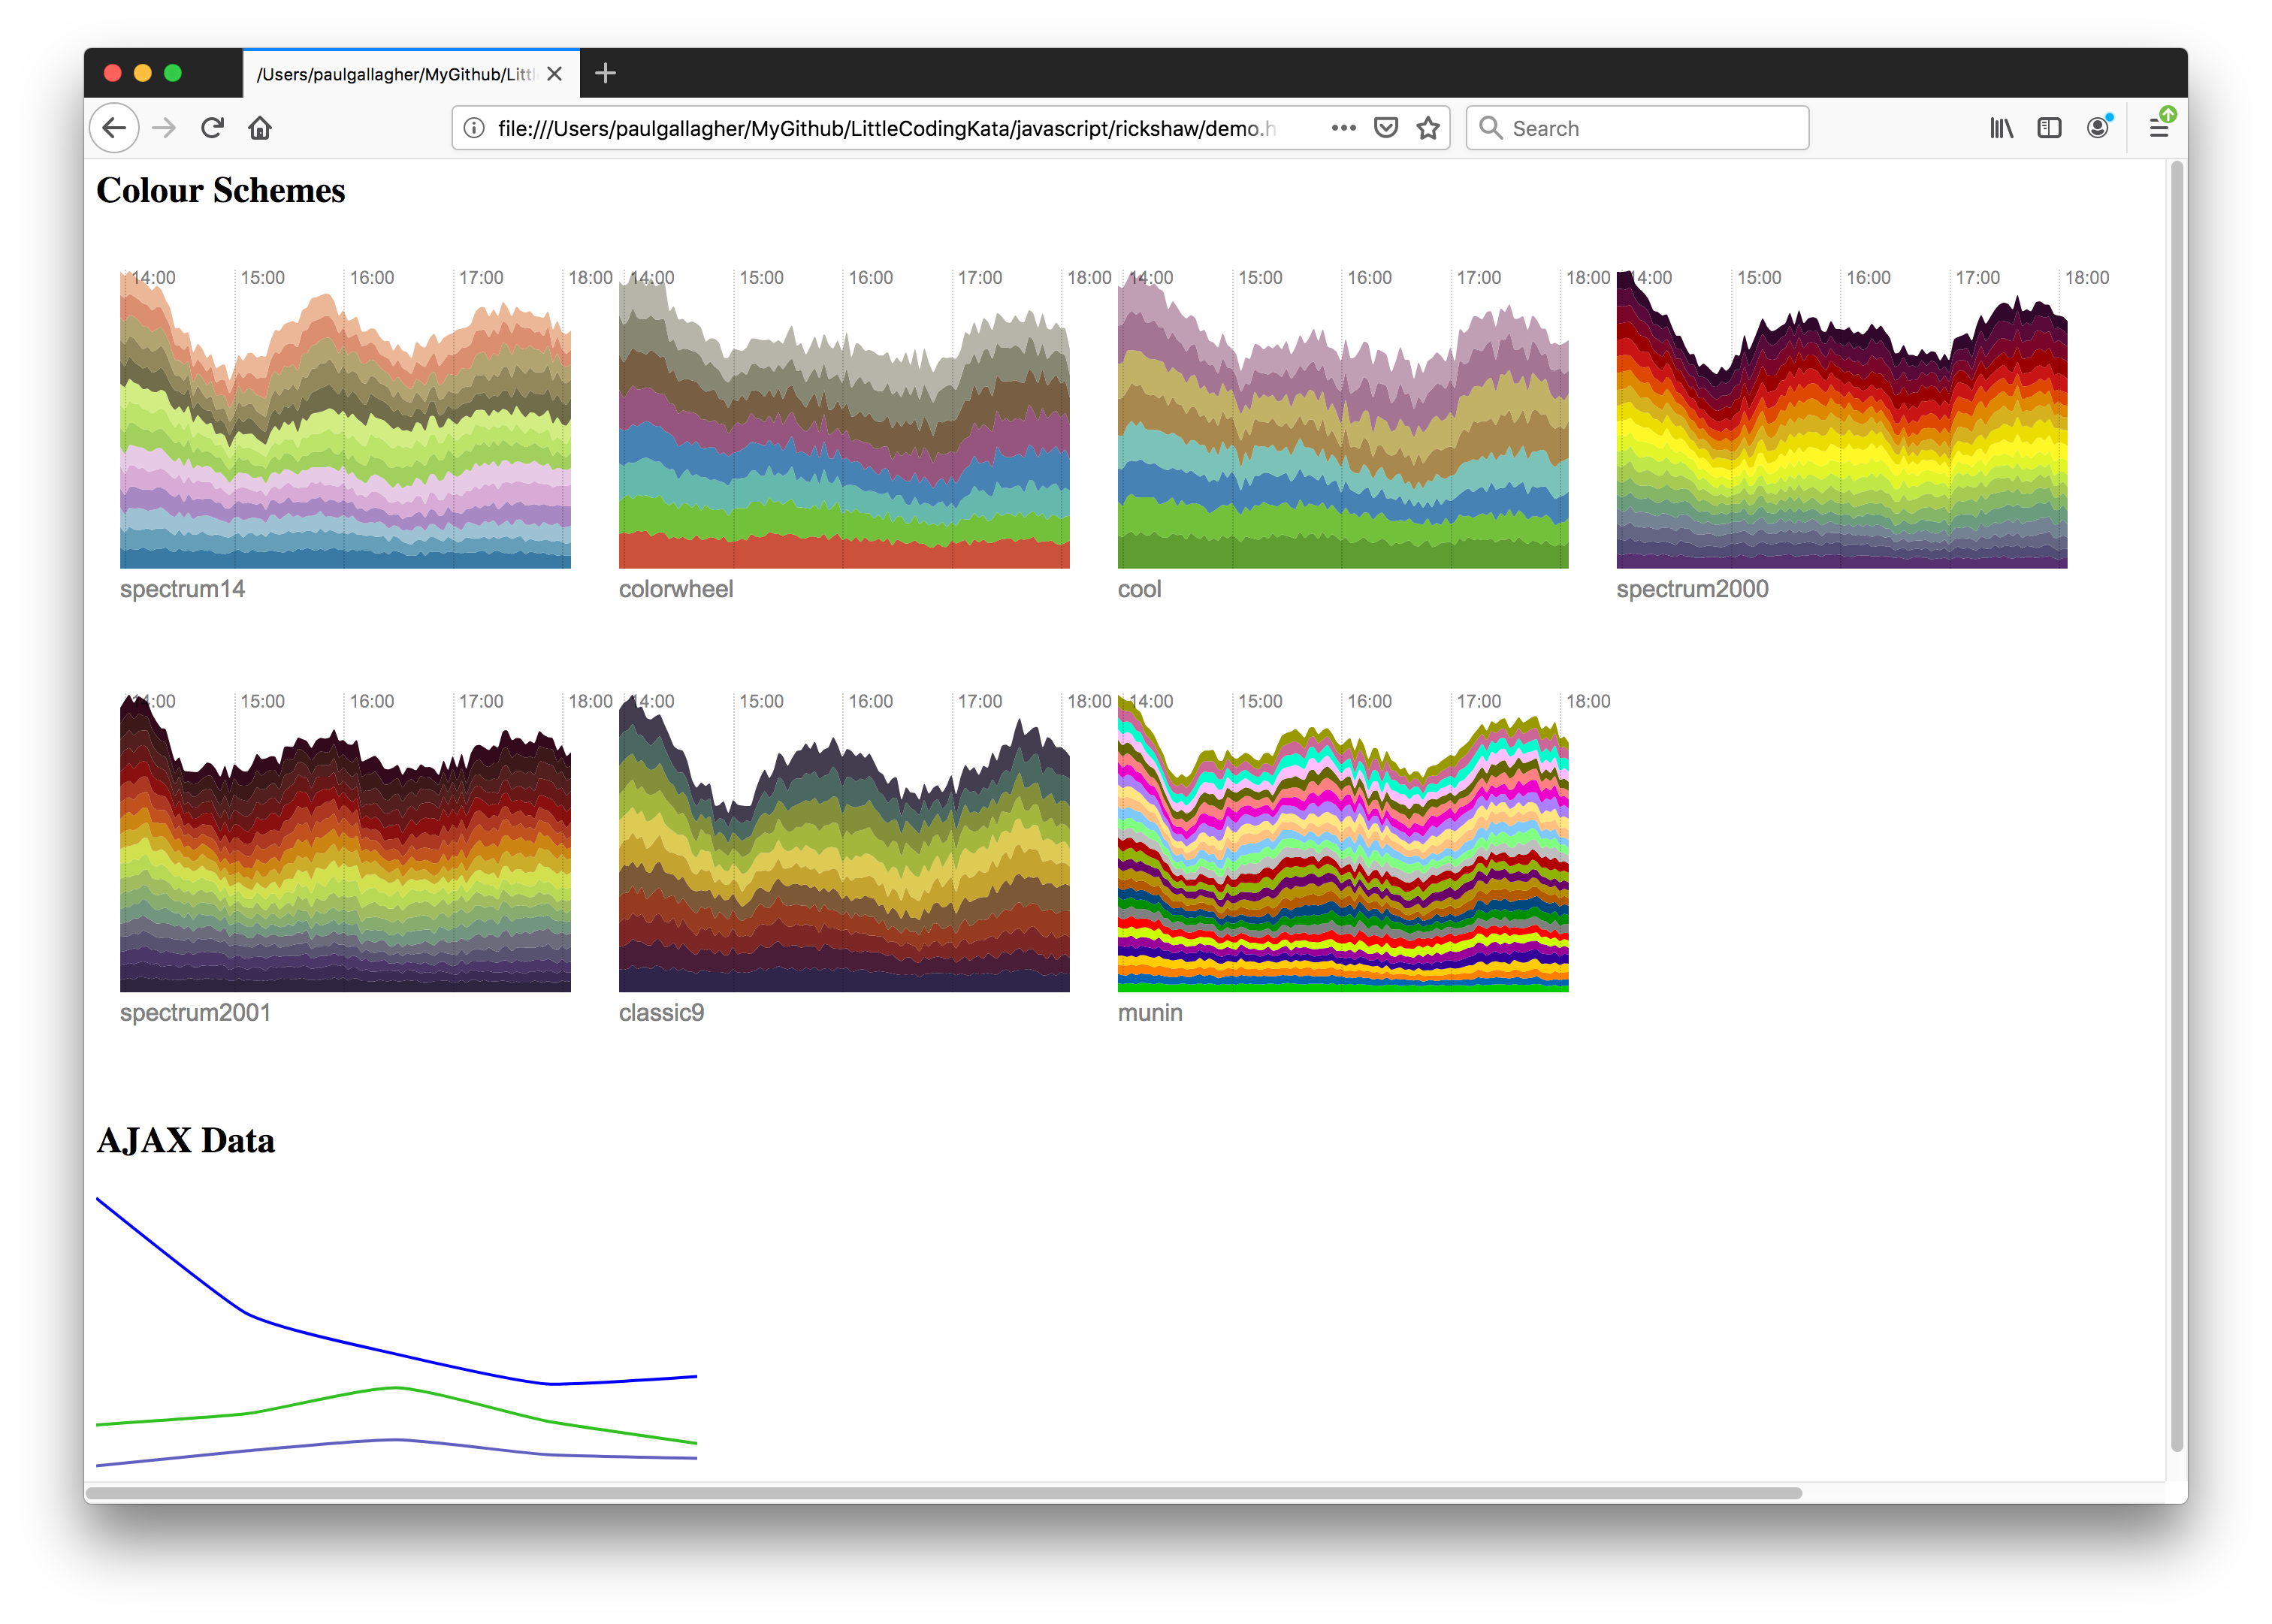
See demo.html for a quick test of:
- applying color palettes
- loading data with AJAX

