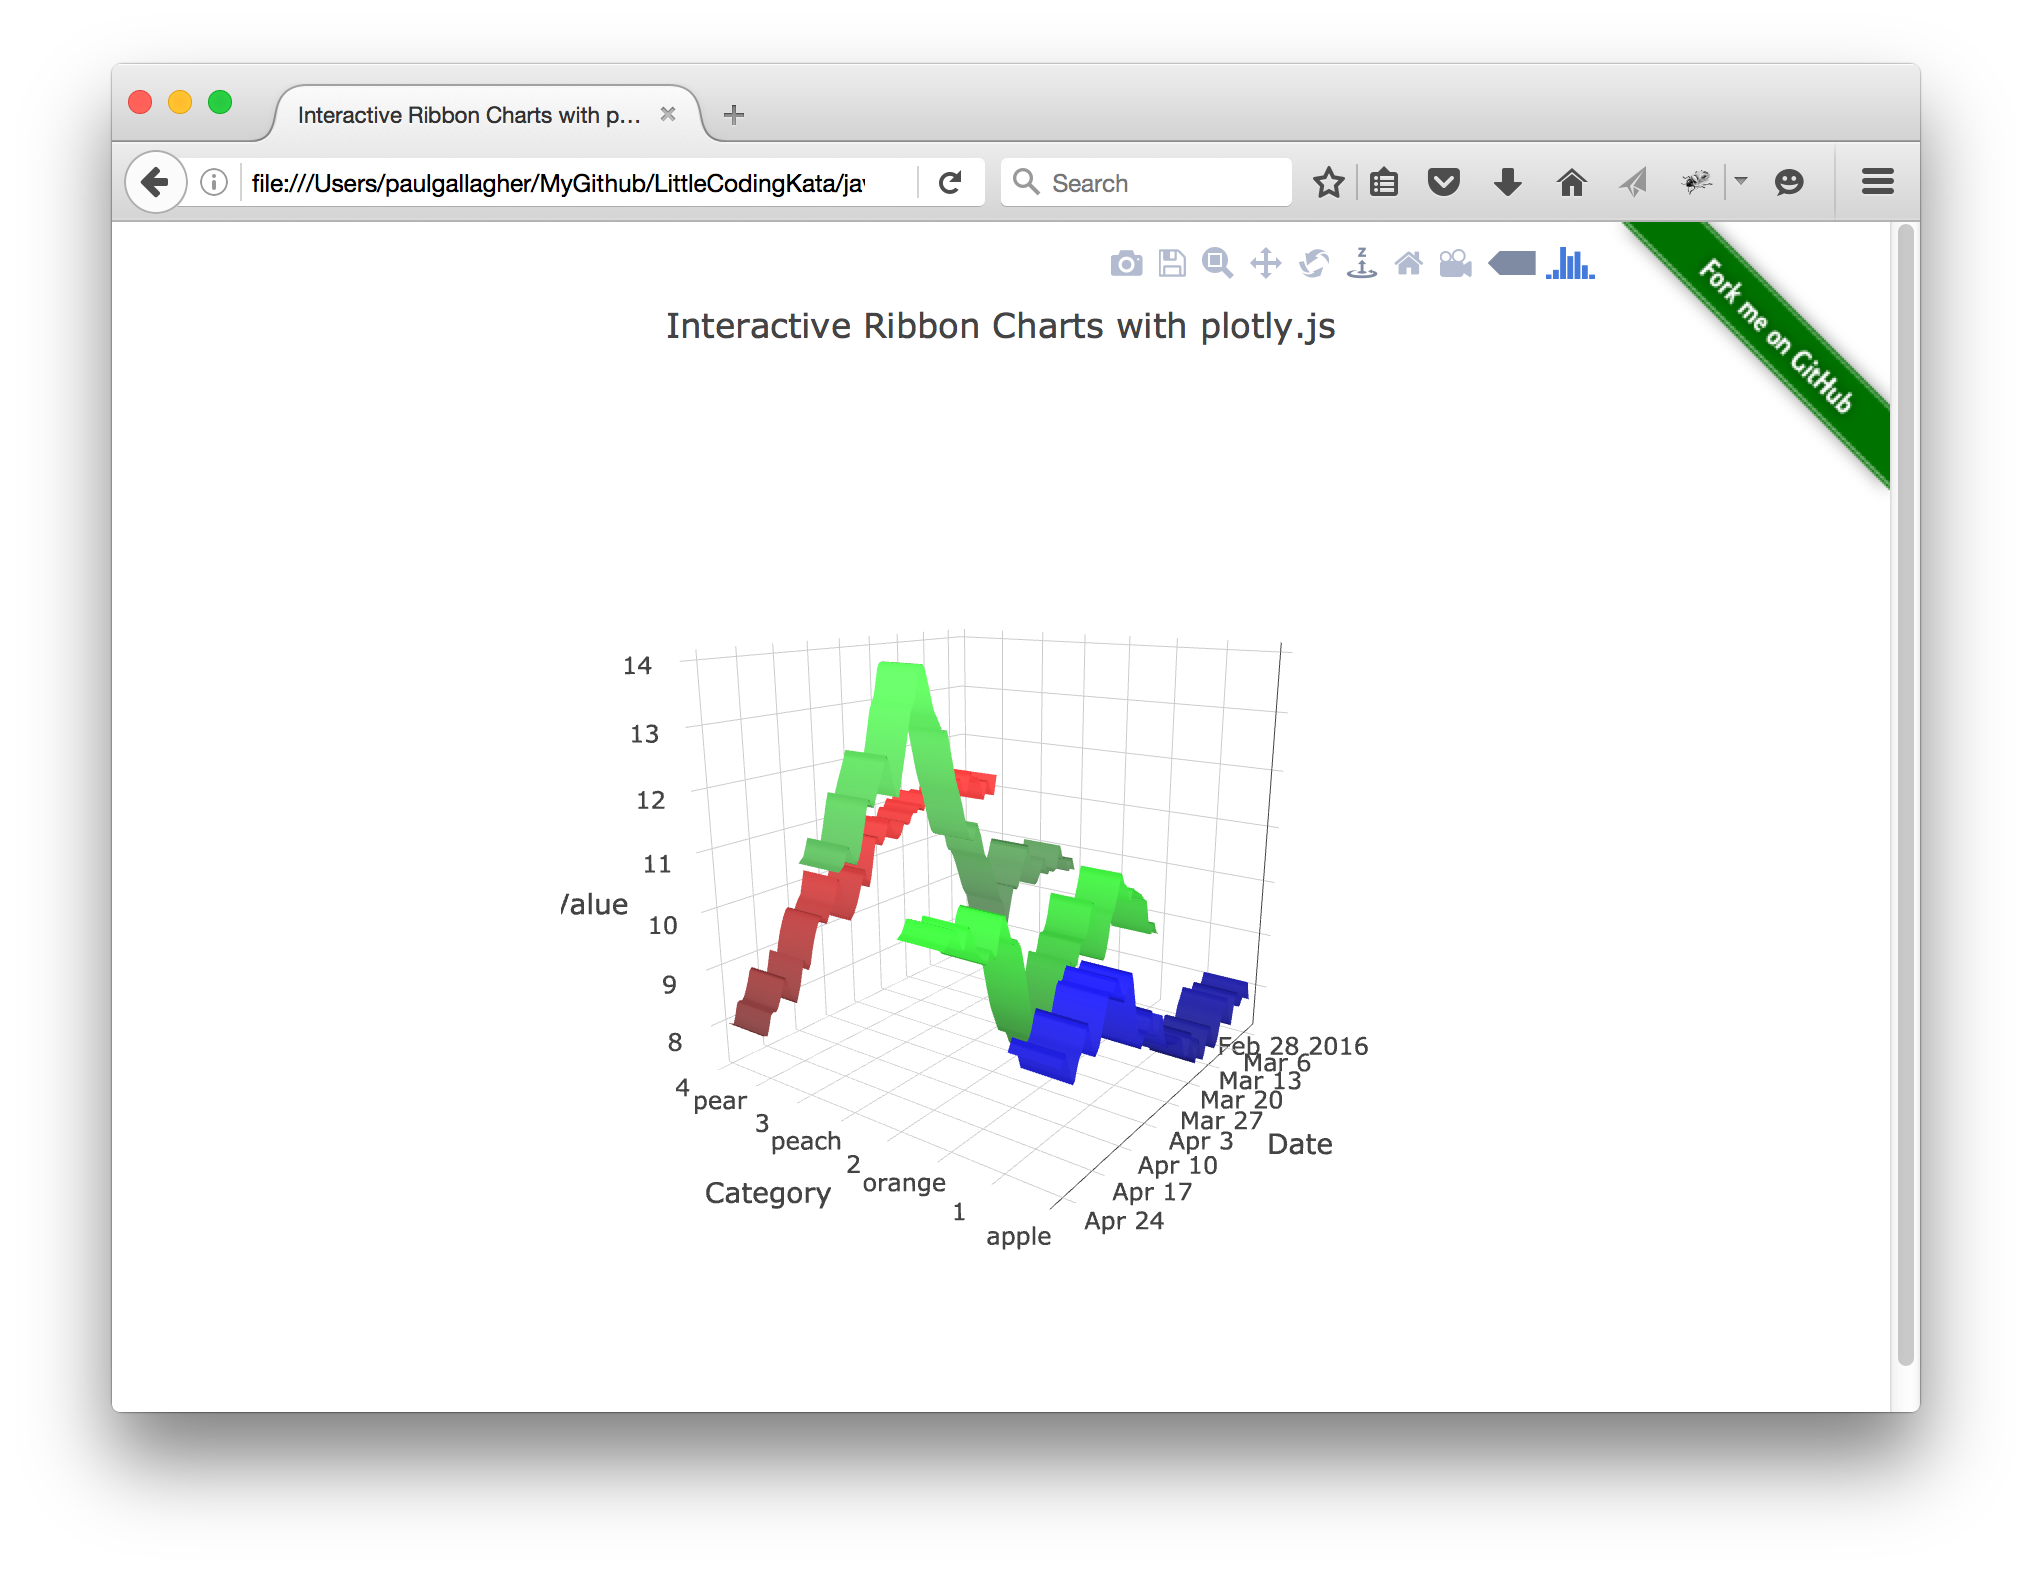
Interactive Ribbon Charts with plotly.js
Test interactive plotly.js ribbon charts with date-related data.
Notes
plotly.js is a pretty awesome library for charting. It extends and is built on D3.js.
Unlike highcharts, plotly supports pretty rich interation with the charts it produces.
Describing a Ribbon Chart
To create a ribbon, we use surface traces to create a newPlot in 3 dimensions:
- xaxis: Category
- yaxis: Date
- zaxis: Value
The data the describes the coordinates of the ribbon is set in z.
Data in z is a 2D array with [start, end] values.
Coordinates in x and y can either be 1D or 2D arrays. For this example:
- a 2D arrays is used for the
xarray to give the ribbon width. Thexaxis basically spreads out (categorizes) the separate traces. - a 1D array of dates is used for the
yarray.
Color Scale
The color scale corresponds to the z values by default. A custom color scales is set with the surfacecolor 2D array, where its bounds can be controlled using cmin and cmax.
Color scales can get quite sophisticated. I’m using the simplest form which sets the min and max colors (0, 1) and let plotly interpolate between them. For example [[0, 'rgb(31,31,128)'], [1, 'rgb(31,31,255)']].
Date Axis
The yaxis is set as type: ‘date’. I can’t find the definitive documentation, but is appears dates may be provided in a flexible range of formats. I demonstrate three versions in the example:
- as a Javascript date object:
new Date(2016, 4, 26) - as milliseconds since midnight January 1, 1970 UTC:
new Date(2016, 4, 26).valueOf - as a simple date string: ‘2016-05-26’
What doesn’t work:
- default Javascript Date strings:
new Date(2016, 4, 26).toString()=> “Fri Feb 26 2016 00:00:00 GMT+0800 (SGT)” - toISOString()
Only a 1D array of dates is required for the y array. But a 2D may be provided.
Catagory Axis
The xaxis is set to type: ‘category’, rather than numeric data.
A 2D array is required to give the ribbon width, so it’s necessary to figure out how to express the category as an array.
I’m using an array of name and number, like ['orange', 2].
Example
The example in example.html is an adaptation of the Ribbon Plots in plotly.js example.
Or run the demo live from GitHub Pages.
Credits and References
- plotly.js - GitHub
- Ribbon Plots in plotly.js - tutorial/example
- D3.js
- Javascript Date Object Reference